Fig. 5.
Download original image
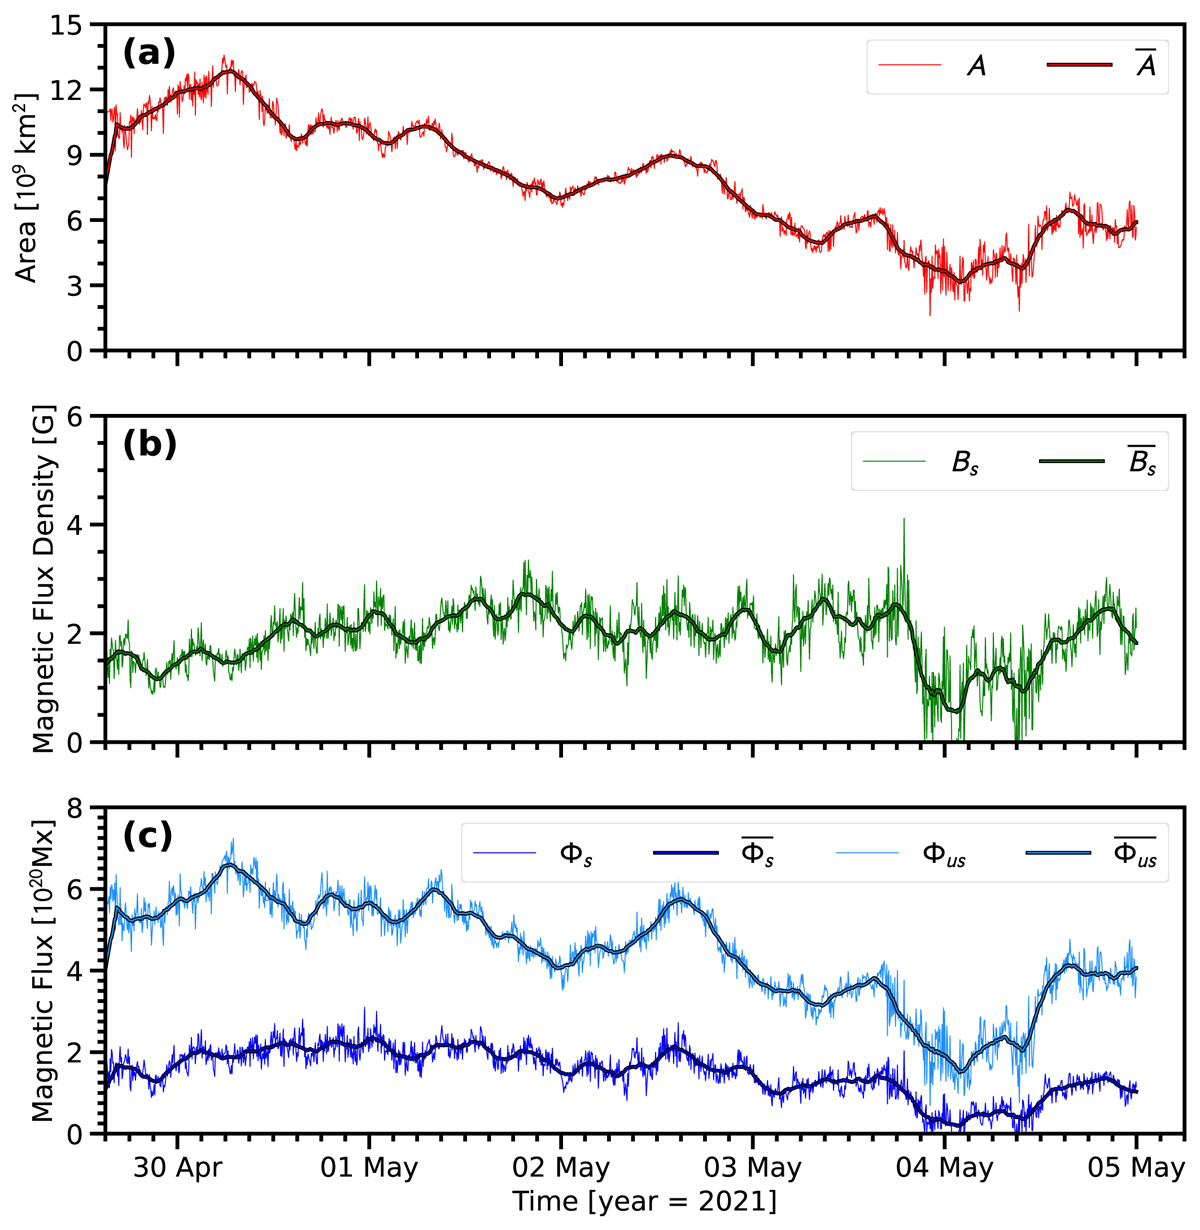
Coronal hole properties as functions of time from April 29 15:00 to May 4 00:00. The coronal hole area (A; red), signed magnetic flux density (Bs;green), unsigned magnetic flux (Φus; light blue), and signed magnetic flux (Φs; blue) are shown from top to bottom with a three-hour running mean highlighted in black (![]() ,
, ![]() ,
, ![]() , and
, and ![]() , respectively).
, respectively).
Current usage metrics show cumulative count of Article Views (full-text article views including HTML views, PDF and ePub downloads, according to the available data) and Abstracts Views on Vision4Press platform.
Data correspond to usage on the plateform after 2015. The current usage metrics is available 48-96 hours after online publication and is updated daily on week days.
Initial download of the metrics may take a while.