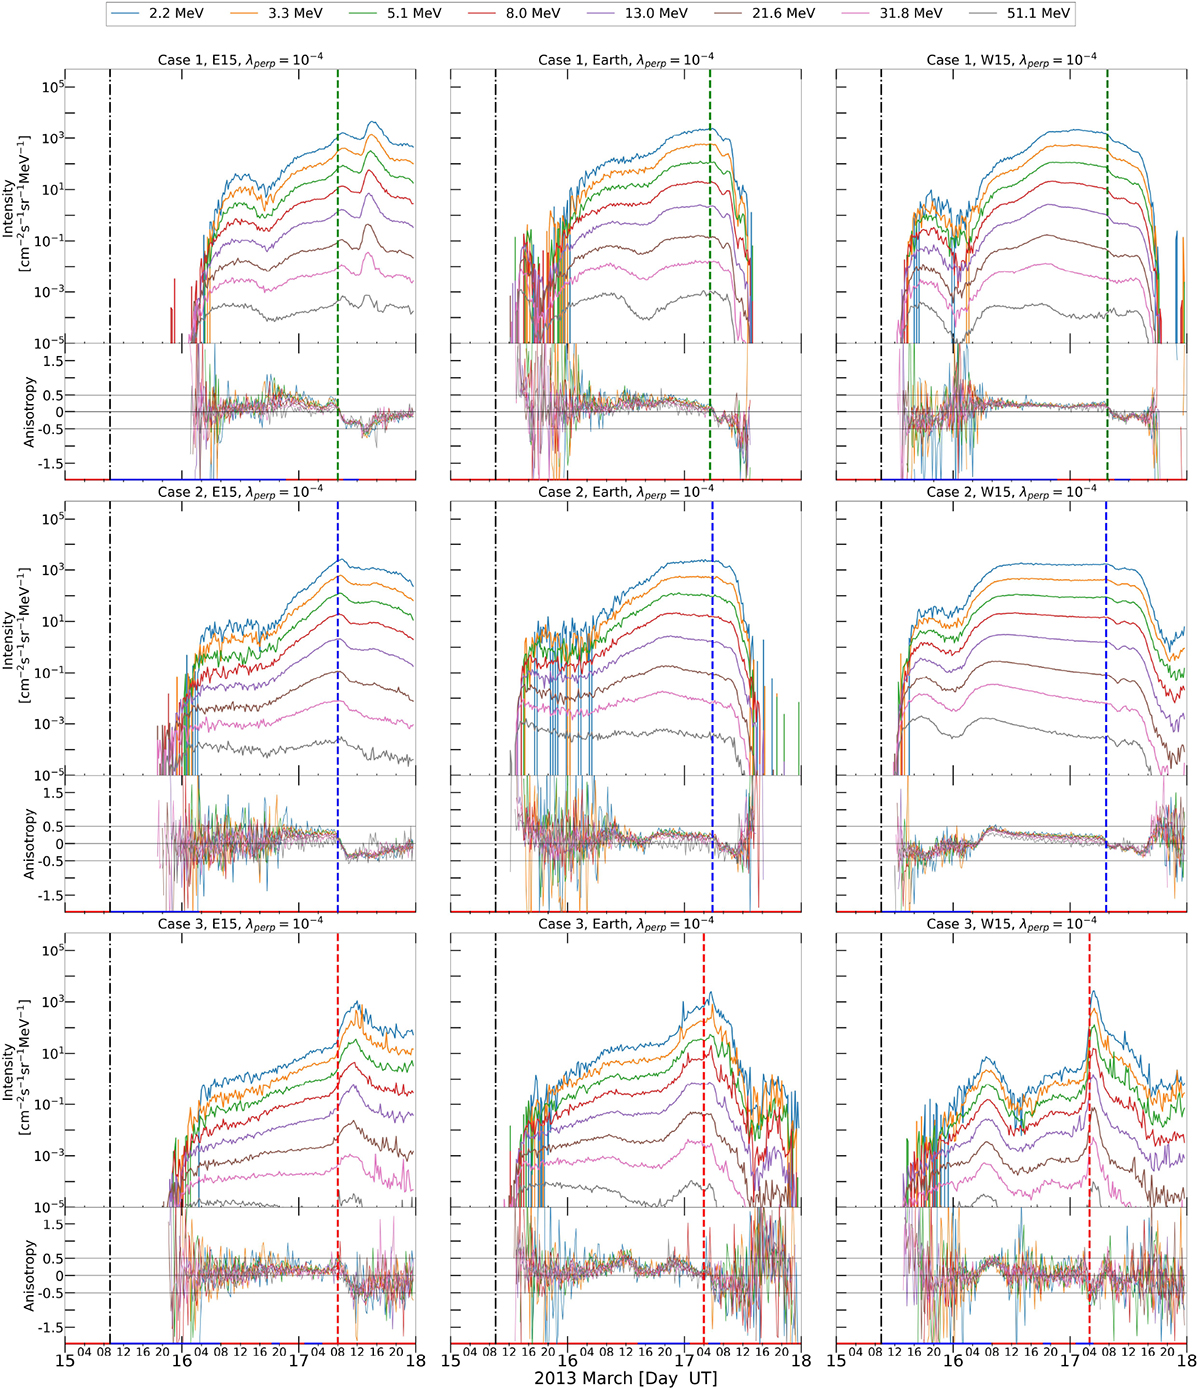
Fig. A.1.
Download original image
PARADISE simulated proton time-intensity profiles (top panels) for energy channels ranging from 2.2 MeV to 51.1 MeV, with their corresponding first-order parallel anisotropy profiles (bottom panels). The top, middle, and bottom rows correspond to Case 1, Case 2, and Case 3 background solar wind for runs where λ⊥/λ∥ ∼ 10−4 at the different virtual spacecraft: E15 (left), Earth (centre), and W15 (right) columns. Dashed green, blue, and red lines correspond to the time of the Main CME-driven shock at the position of the virtual spacecraft for each of the cases. The vertical dash-dotted black line marks the time of injection of the Main CME at the inner boundary of the EUHFORIA model. The bottom red (blue) line indicates the periods of positive (negative) values of the radial component of the simulated magnetic field at the position of each spacecraft.
Current usage metrics show cumulative count of Article Views (full-text article views including HTML views, PDF and ePub downloads, according to the available data) and Abstracts Views on Vision4Press platform.
Data correspond to usage on the plateform after 2015. The current usage metrics is available 48-96 hours after online publication and is updated daily on week days.
Initial download of the metrics may take a while.