Fig. 7.
Download original image
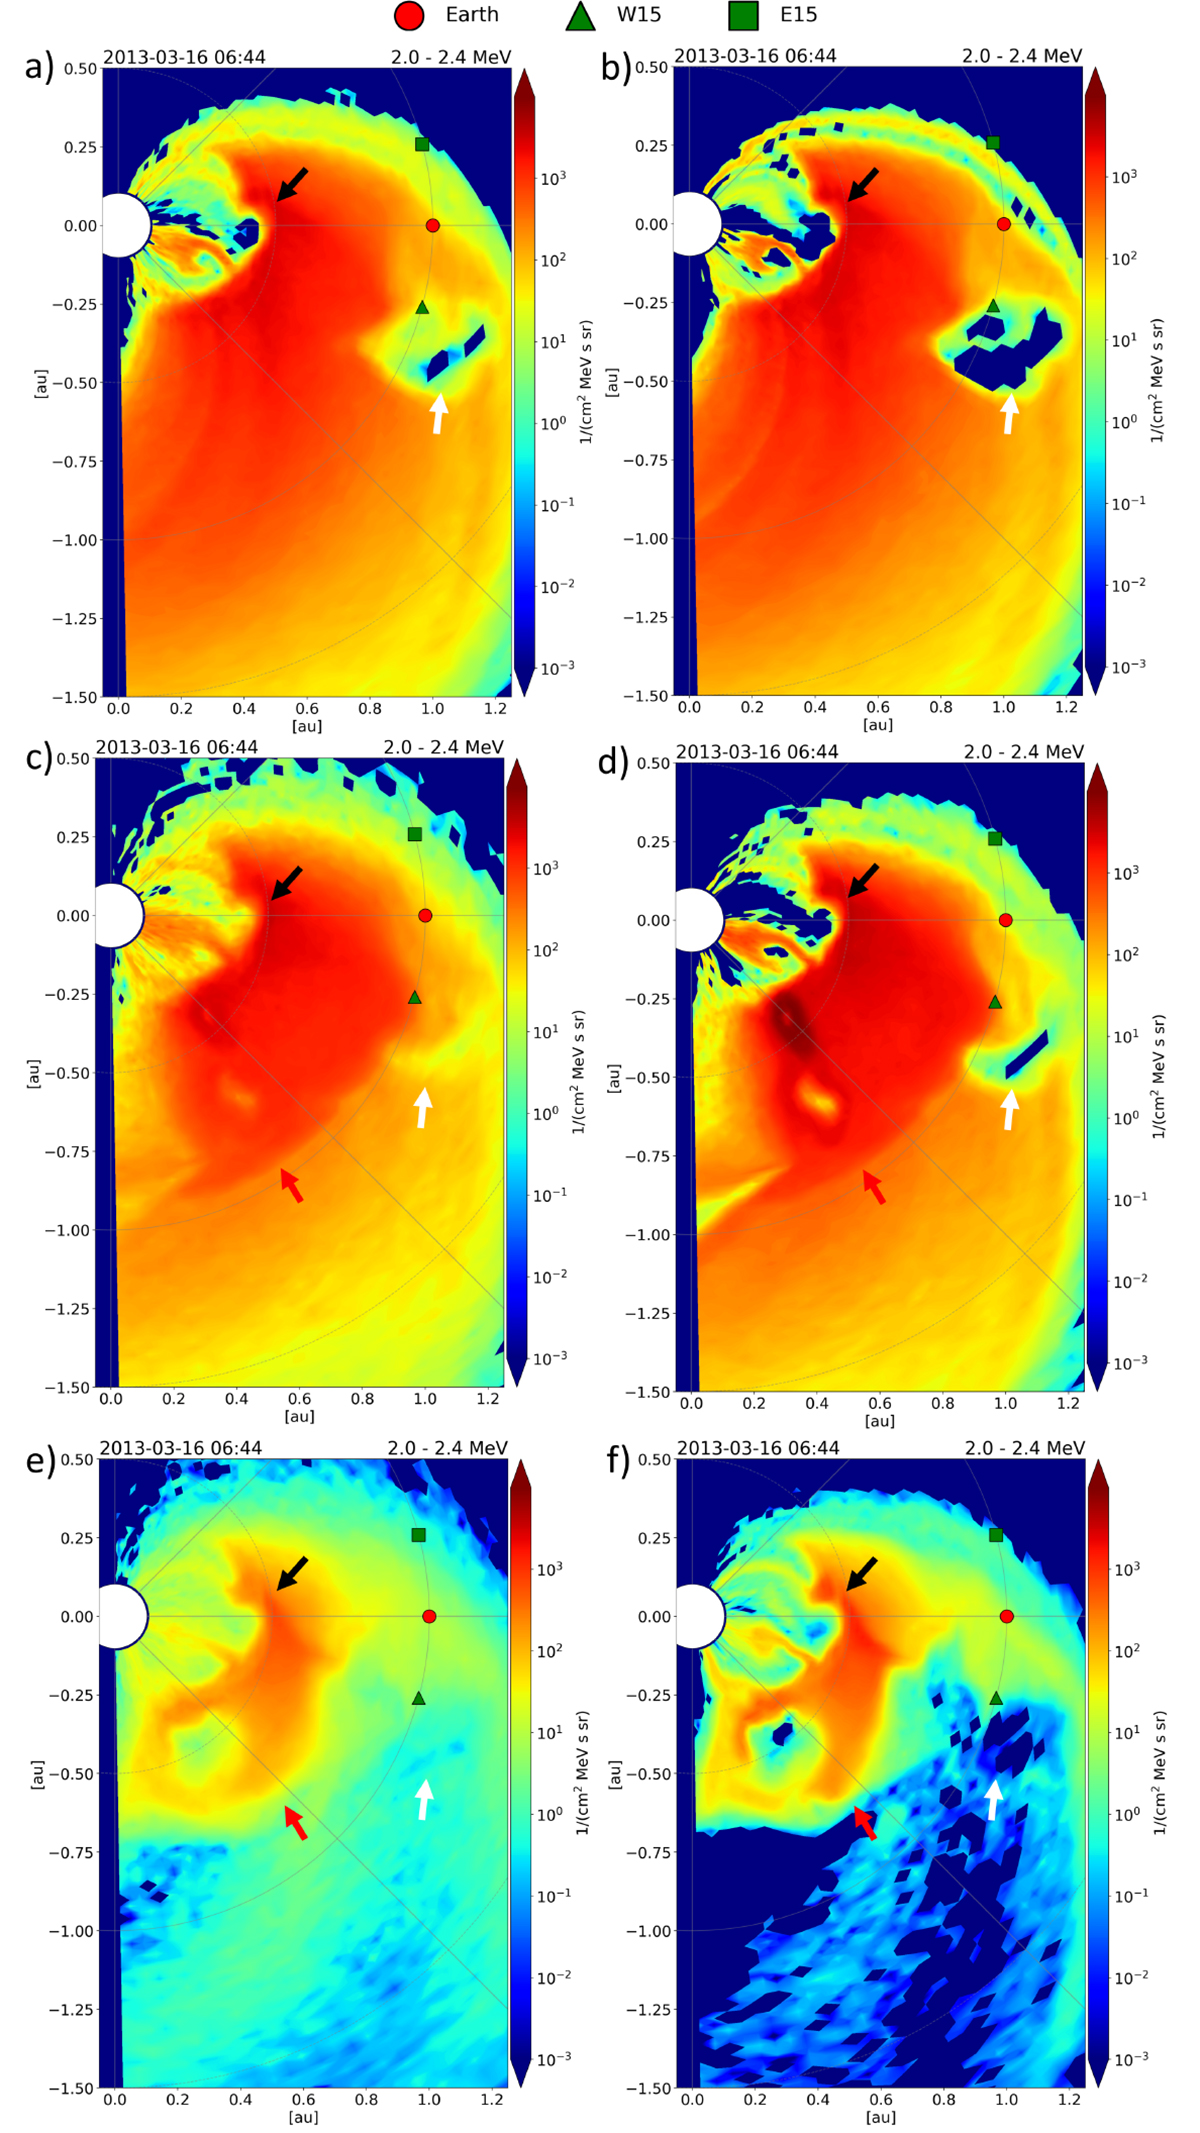
PARADISE simulation snapshot for 2013 March 16, 06:44 UT. Panels a and b correspond to Case 1, panels c and d correspond to Case 2, and panels e and f correspond to Case 3 background solar wind. The left column shows the simulations using λ⊥/λ∥ ∼ 10−3, while the right column corresponds to λ⊥/λ∥ ∼ 10−4. E15, Earth, and W15 virtual spacecraft are represented with a green square, a red circle, and a green triangle (respectively). White, red, and black arrows point at the approximate position of the First, Second, and Main CME, respectively. The temporal evolution of each case is available as an online movie.
Current usage metrics show cumulative count of Article Views (full-text article views including HTML views, PDF and ePub downloads, according to the available data) and Abstracts Views on Vision4Press platform.
Data correspond to usage on the plateform after 2015. The current usage metrics is available 48-96 hours after online publication and is updated daily on week days.
Initial download of the metrics may take a while.