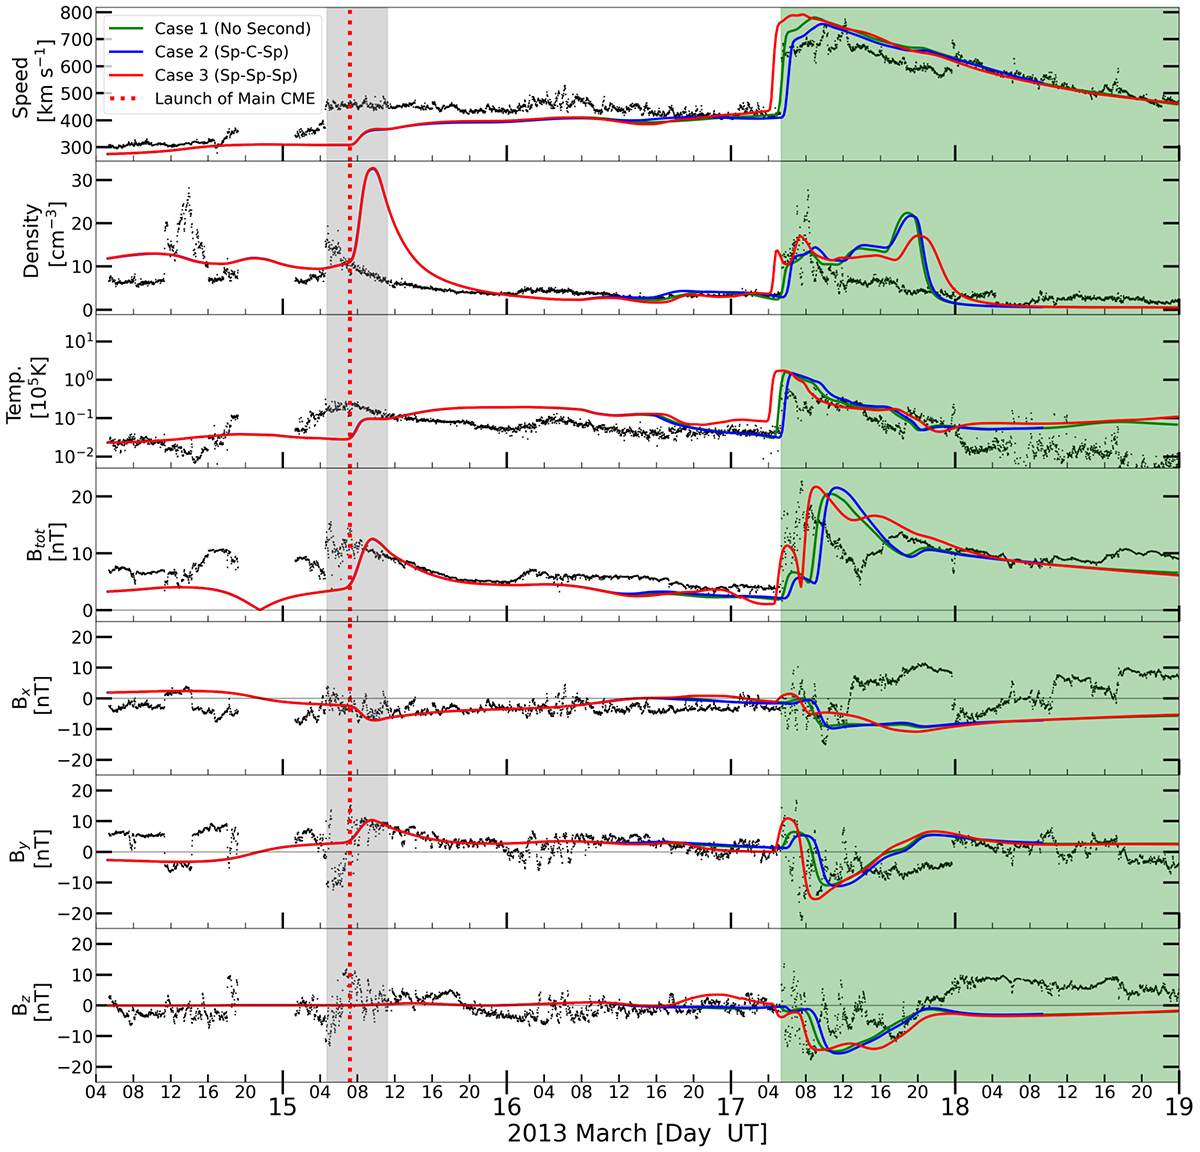
Fig. 5.
Download original image
EUHFORIA simulations compared with in situ data. Top to bottom: solar wind speed, density, temperature, total magnetic field, and its three components. In all panels, the observations from Wind spacecraft (black dots) and EUHFORIA simulation results are given for Case 1 (green), Case 2 (blue), and Case 3 (red). The vertical dotted red line shows the launch time of the Main CME event from the Sun. Grey and green shaded areas correspond to the duration of the First and Main CME’s impact at Earth.
Current usage metrics show cumulative count of Article Views (full-text article views including HTML views, PDF and ePub downloads, according to the available data) and Abstracts Views on Vision4Press platform.
Data correspond to usage on the plateform after 2015. The current usage metrics is available 48-96 hours after online publication and is updated daily on week days.
Initial download of the metrics may take a while.