Fig. 4.
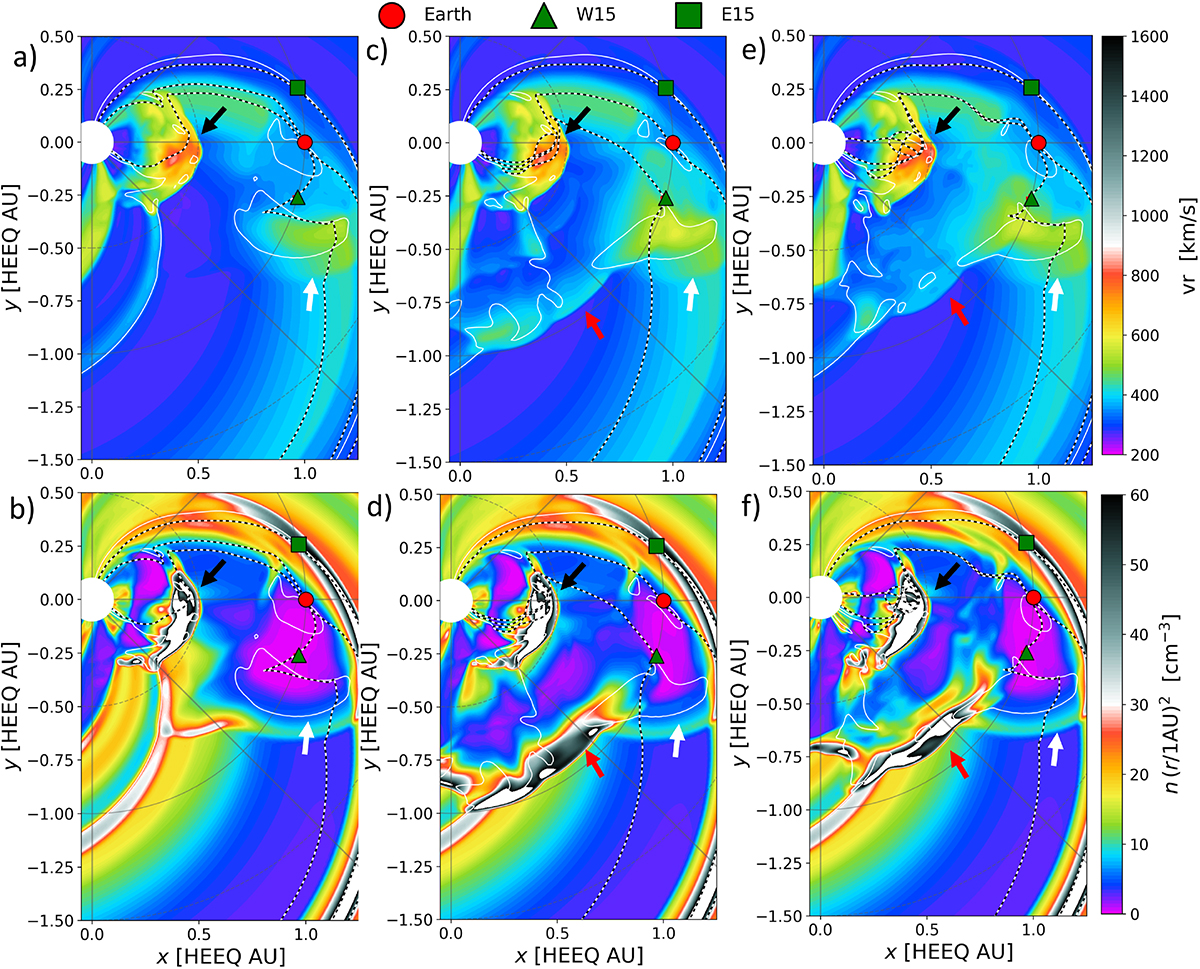
Download original image
Snapshot of the EUHFORIA simulations for Case 1 (a and b), Case 2 (c and d), and Case 3 (e and f) for 2013 March 16 at 06:44 UT. The top row shows the radial solar wind speed, and the bottom row shows the scaled number density in the equatorial plane. White, red, and black arrows point at the approximate position of the First, Second, and Main CMEs (respectively). Dashed lines correspond to the magnetic field line connection from the E15, Earth, and W15 positions, backtracked to 0.1 au. The temporal evolution for (a), (c), and (e) are available as an online movie.
Current usage metrics show cumulative count of Article Views (full-text article views including HTML views, PDF and ePub downloads, according to the available data) and Abstracts Views on Vision4Press platform.
Data correspond to usage on the plateform after 2015. The current usage metrics is available 48-96 hours after online publication and is updated daily on week days.
Initial download of the metrics may take a while.