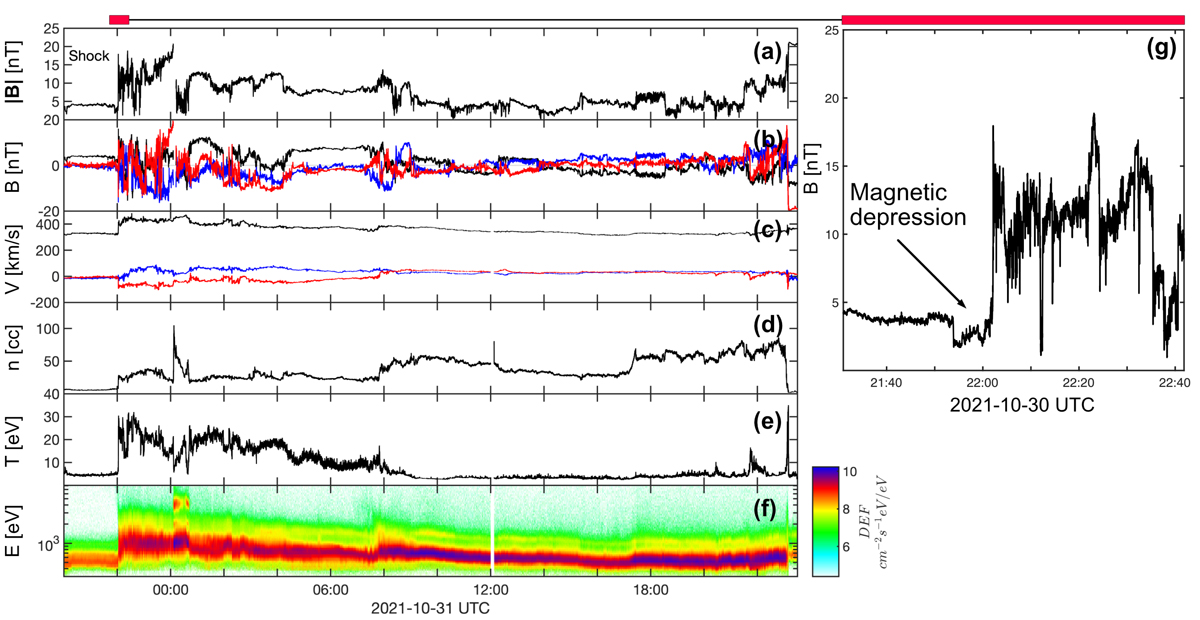
Fig. 2.
Download original image
ICME observed by Solar Orbiter between 30–31 October 2021. Panels a–e show |B|, B, V, n, T, respectively and the bottom panel f is the DEF. Panel g shows a zoomed in plot of the magnetic field magnitude around the shock crossing.
Current usage metrics show cumulative count of Article Views (full-text article views including HTML views, PDF and ePub downloads, according to the available data) and Abstracts Views on Vision4Press platform.
Data correspond to usage on the plateform after 2015. The current usage metrics is available 48-96 hours after online publication and is updated daily on week days.
Initial download of the metrics may take a while.