Fig. 6.
Download original image
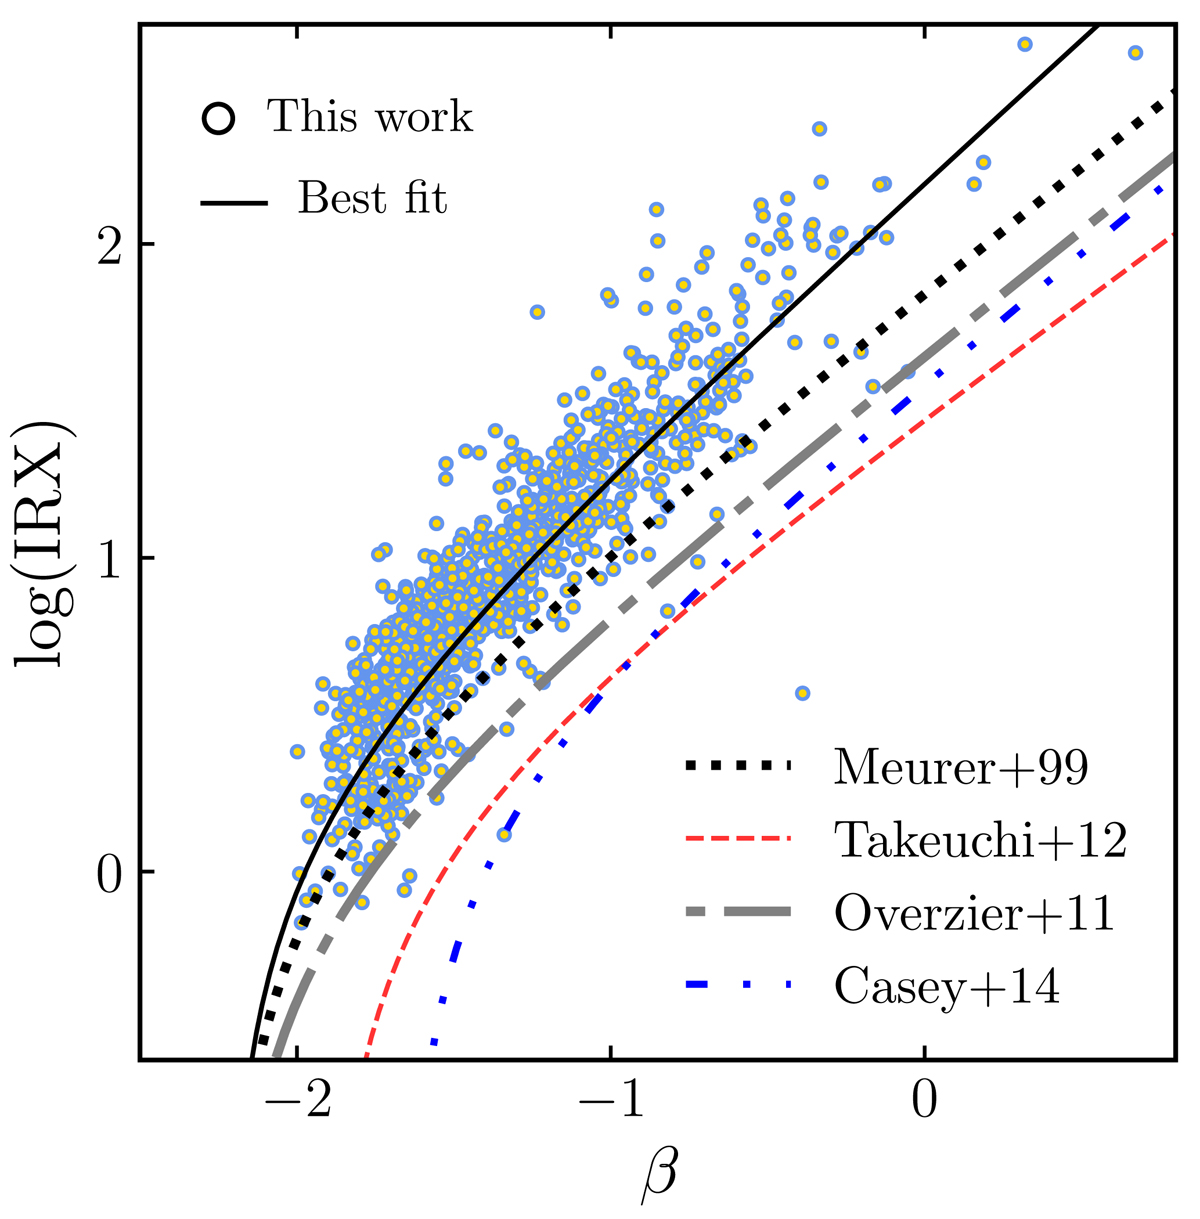
IRX–β scatter of our sample. The original Meurer et al. (1999) fit is shown in dotted line. We also make a comparison with the fits from Overzier et al. (2011), Takeuchi et al. (2012), Casey et al. (2014), denoted with grey dashed-dotted, red dashed, and dashed-double-dotted lines, respectively. The solid black line shows Eq. (9), describing our sample.
Current usage metrics show cumulative count of Article Views (full-text article views including HTML views, PDF and ePub downloads, according to the available data) and Abstracts Views on Vision4Press platform.
Data correspond to usage on the plateform after 2015. The current usage metrics is available 48-96 hours after online publication and is updated daily on week days.
Initial download of the metrics may take a while.