Open Access
Fig. 4.
Download original image
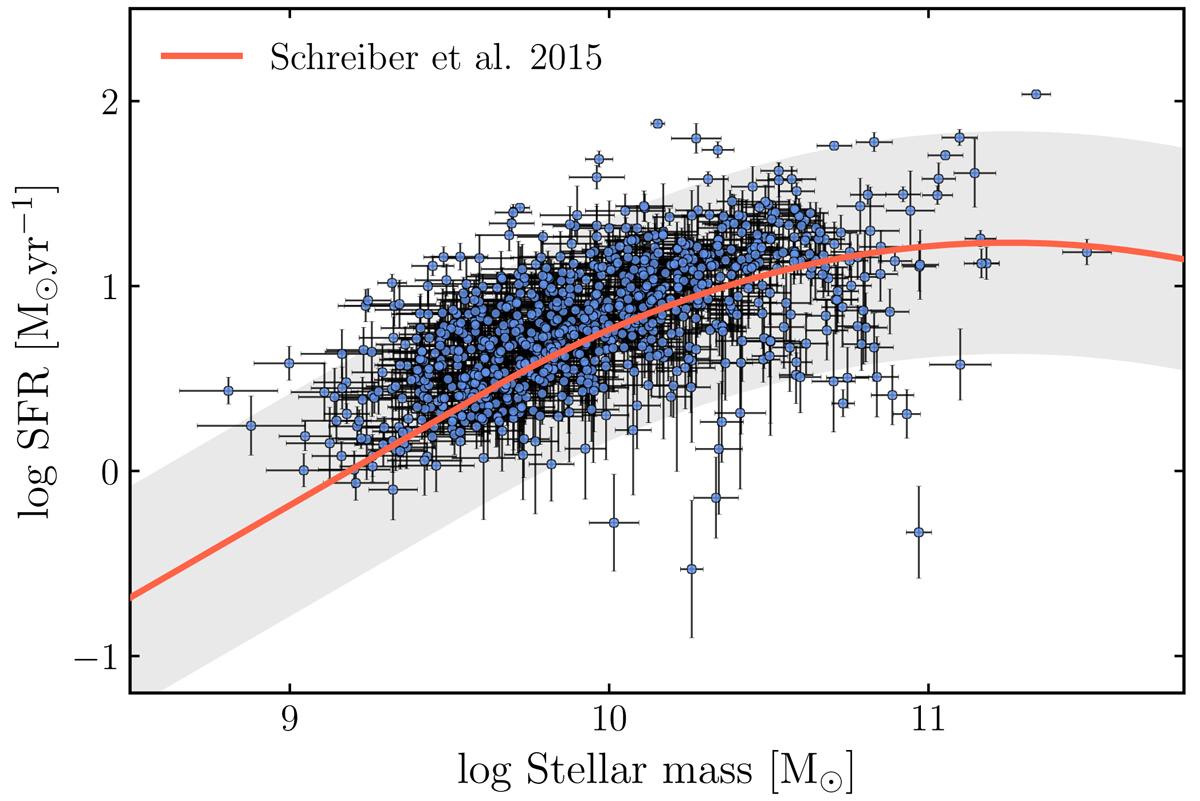
Star formation rates for our sample fitted with the best attenuation curve against stellar masses. The red line shows the main sequence of star-forming galaxies from Schreiber et al. (2015) at z = 0.6 (median for our sample).
Current usage metrics show cumulative count of Article Views (full-text article views including HTML views, PDF and ePub downloads, according to the available data) and Abstracts Views on Vision4Press platform.
Data correspond to usage on the plateform after 2015. The current usage metrics is available 48-96 hours after online publication and is updated daily on week days.
Initial download of the metrics may take a while.