Fig. 3.
Download original image
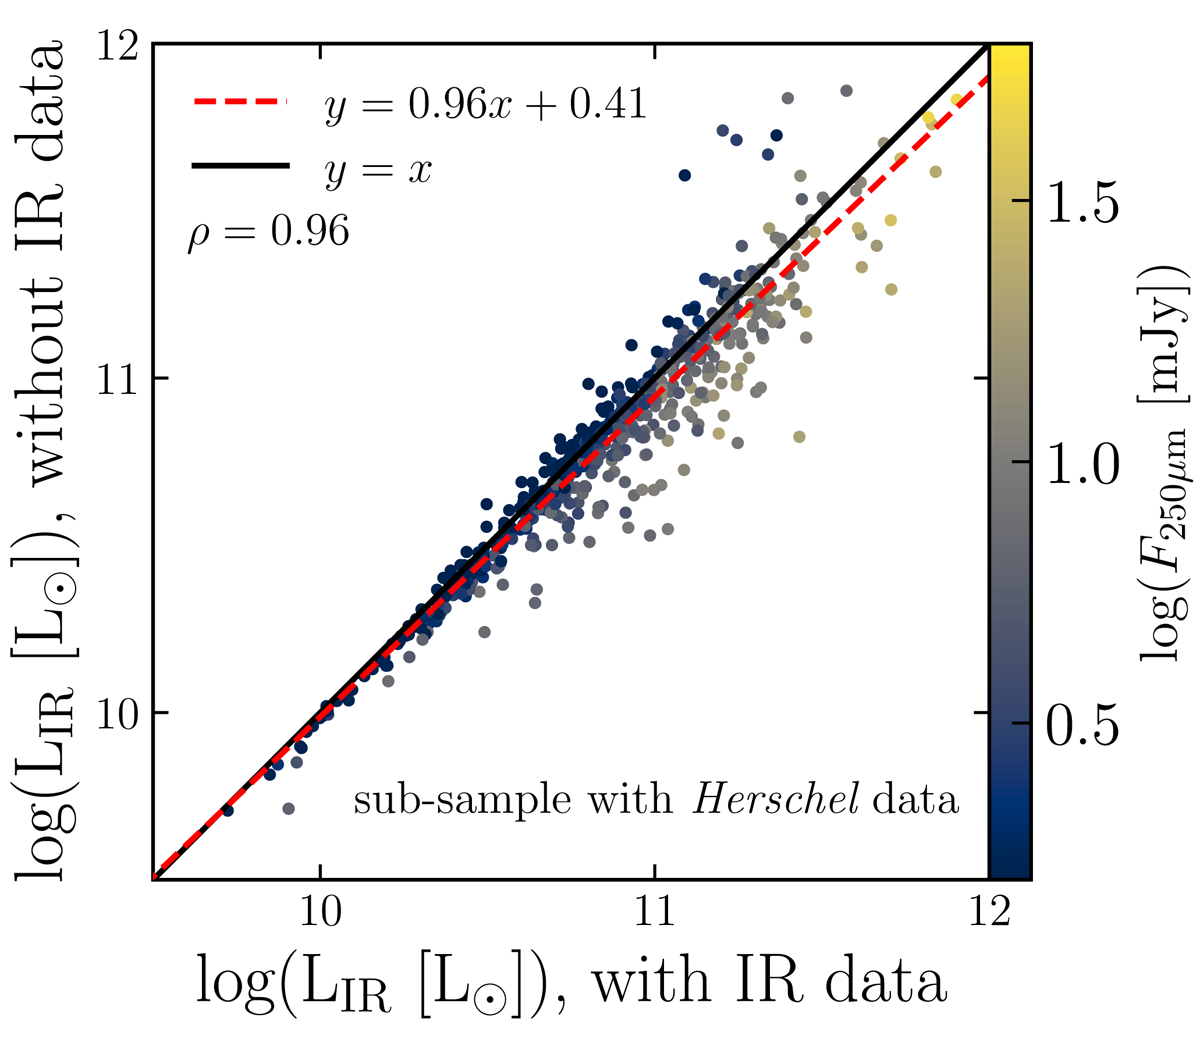
Dust luminosities estimated for the IR-detected sub-sample (592 galaxies out of 1049), with and without IR data. The solid black line shows the one-to-one relation. The dashed red line shows the best fit of this comparison, and ρ is the Pearson coefficient. The scatter is color-coded with the fluxes of the sub-sample at 250 μm.
Current usage metrics show cumulative count of Article Views (full-text article views including HTML views, PDF and ePub downloads, according to the available data) and Abstracts Views on Vision4Press platform.
Data correspond to usage on the plateform after 2015. The current usage metrics is available 48-96 hours after online publication and is updated daily on week days.
Initial download of the metrics may take a while.