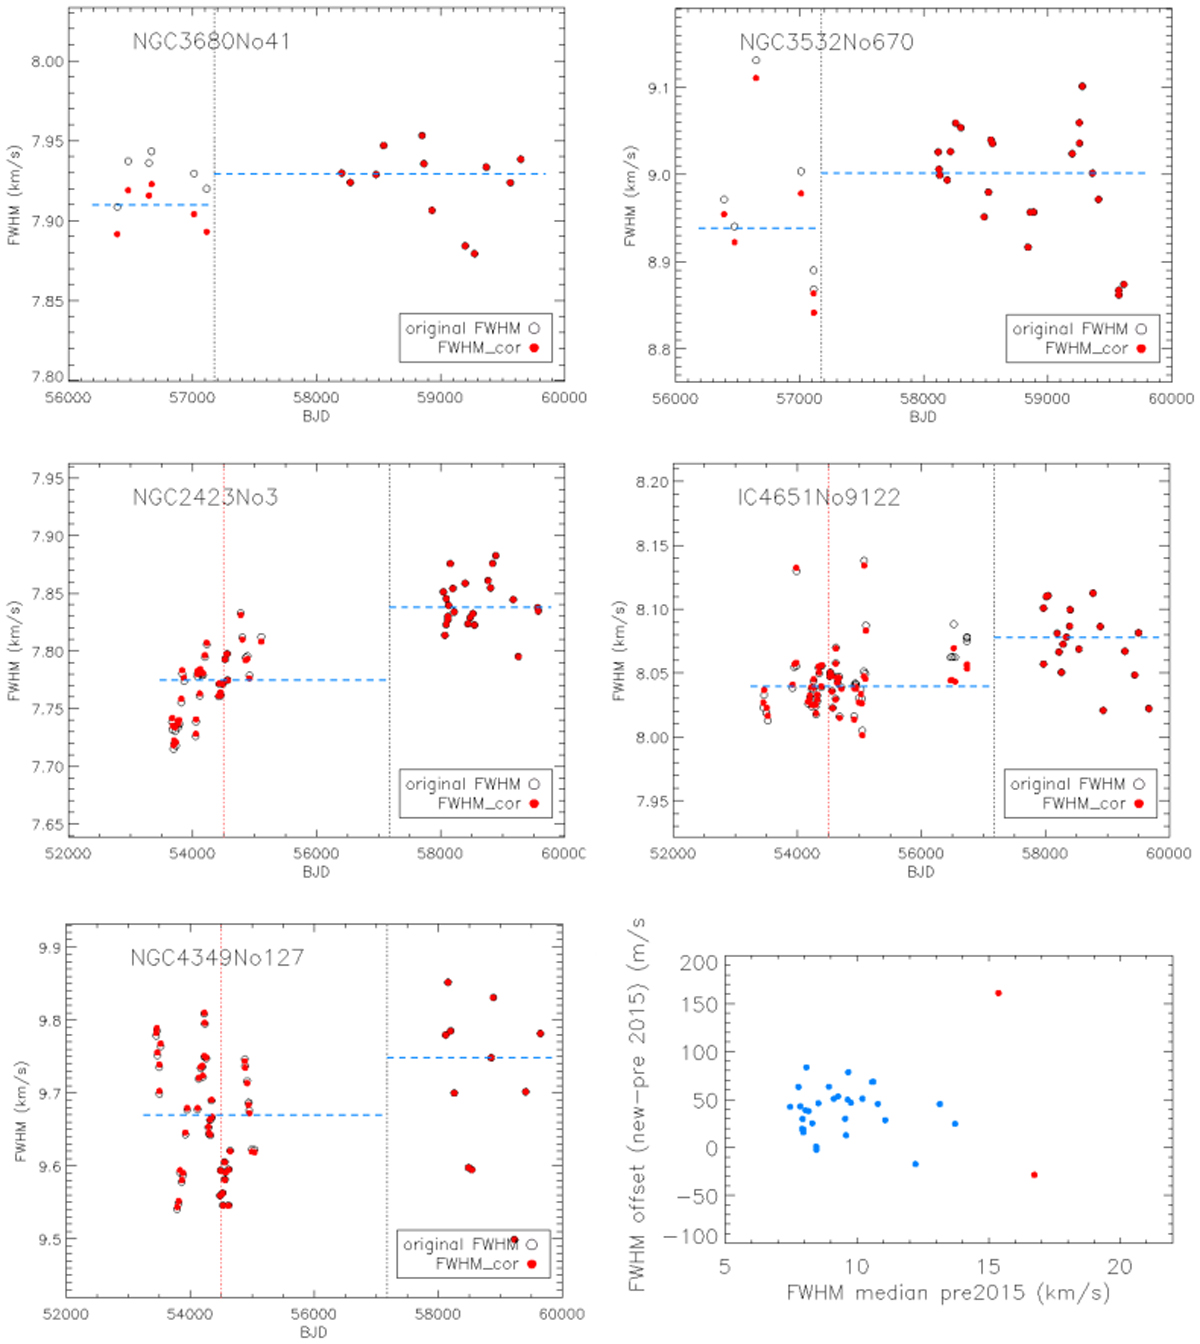
Fig. A.2

Download original image
FWHM values before and after the 2015 fiber change (marked with a black dashed line) for the 5 stars in this paper. The red points are the final FWHM values after considering the focus drift correction which only affect the data pre-2015. The horizontal blue dashed lines mark the median values before and after fiber change to calculate the observed FWHM offset. The bottom-right plot shows the FWHM offset (which is positive for most of the stars) for all the stars in our sample with more than 5 observations before and after the fiber change.
Current usage metrics show cumulative count of Article Views (full-text article views including HTML views, PDF and ePub downloads, according to the available data) and Abstracts Views on Vision4Press platform.
Data correspond to usage on the plateform after 2015. The current usage metrics is available 48-96 hours after online publication and is updated daily on week days.
Initial download of the metrics may take a while.


