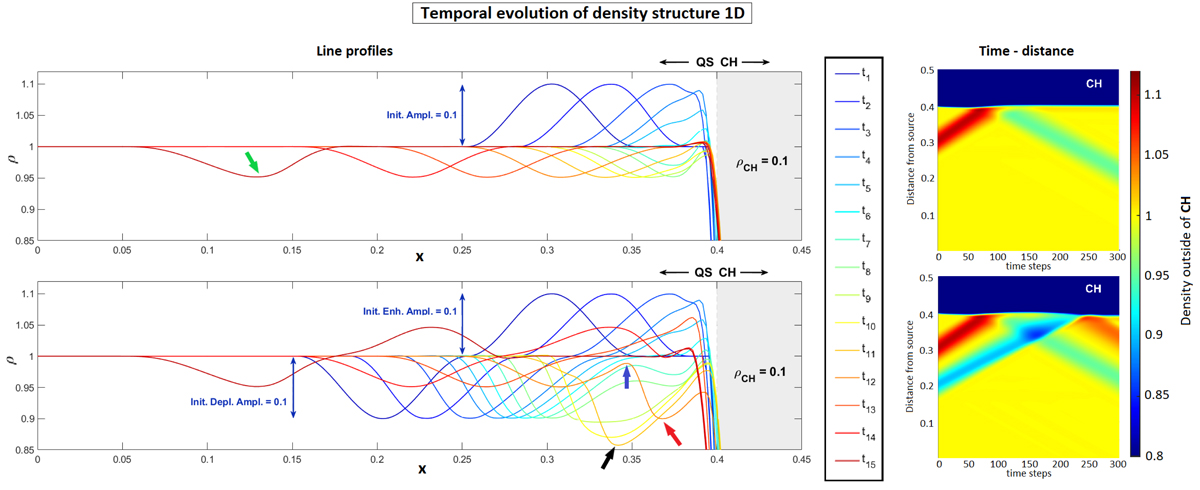
Fig. 3.
Download original image
Temporal evolution of the density distribution of a CW–CH interaction for the 1D case. The upper panel shows the case of an incoming wave that consists of a purely enhanced wave pulse, whereas the lower panel depicts the situation of a more realistic initial density profile, including an enhanced as well as a depleted wave part. Next to the line profiles, we can see the corresponding time-distance plots. The black and the green arrows point at the minimum density values of the simulated interaction which show good agreement with the analytical values based on the reflection coefficient in Eq. (9). The blue and the red arrows show where the reflected wave, which still exhibits negative density values at that time, starts getting pushed towards the background density level. We note that the temporal evolution of both situations can also be seen in online Movie 1.
Current usage metrics show cumulative count of Article Views (full-text article views including HTML views, PDF and ePub downloads, according to the available data) and Abstracts Views on Vision4Press platform.
Data correspond to usage on the plateform after 2015. The current usage metrics is available 48-96 hours after online publication and is updated daily on week days.
Initial download of the metrics may take a while.