Fig. 4
Download original image
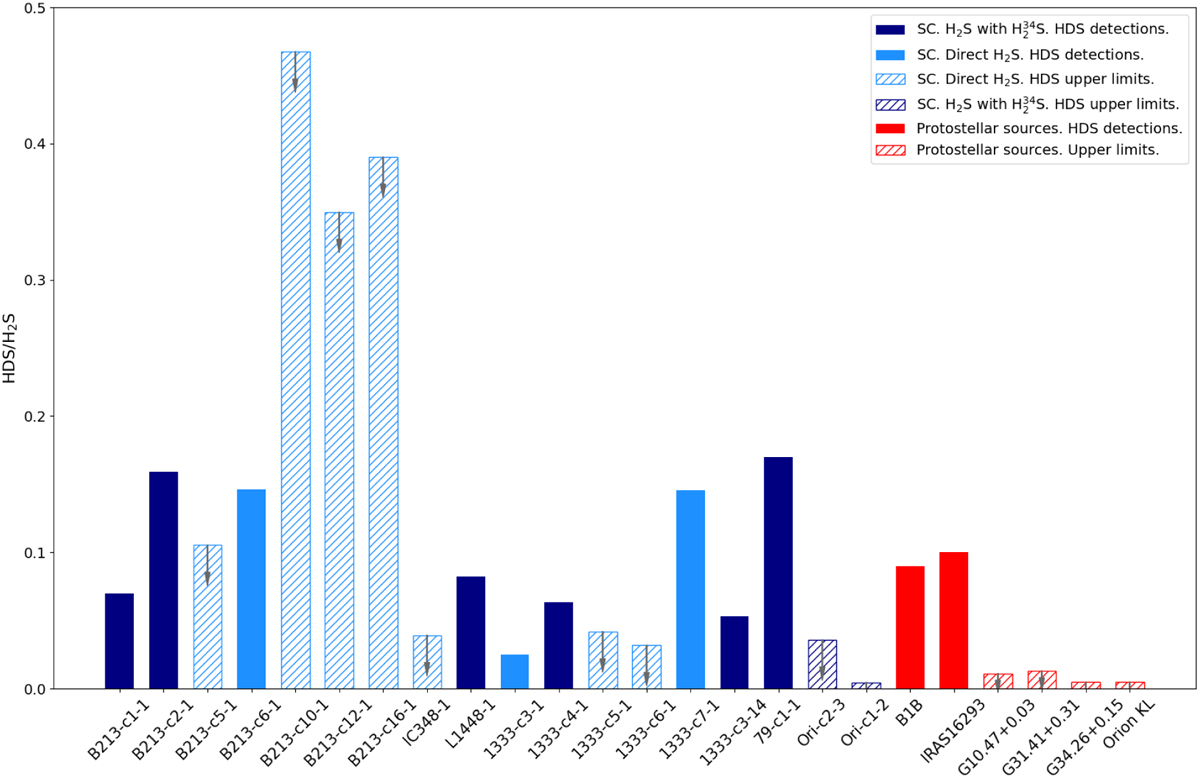
Comparison of H2S deuterium fraction, HDS/H2S, in starless cores (blue) and protostellar sources (red). The bar pattern indicates the direct detection (solid) or determination of upper limits (dashed) of the HDS emission. The starless cores’ dataset is colour-coded according to the method applied for the estimation of the H2S abundance, as shown in the legend. References: Starless cores: This work. B1b: This work. IRAS 16293: van Dishoeck et al. (1995). G10.47+0.03, G31.41+0.31 and G34.26+0.15: Hatchell et al. (1999). Orion KL: Crockett et al. (2014).
Current usage metrics show cumulative count of Article Views (full-text article views including HTML views, PDF and ePub downloads, according to the available data) and Abstracts Views on Vision4Press platform.
Data correspond to usage on the plateform after 2015. The current usage metrics is available 48-96 hours after online publication and is updated daily on week days.
Initial download of the metrics may take a while.