Fig. 3.
Download original image
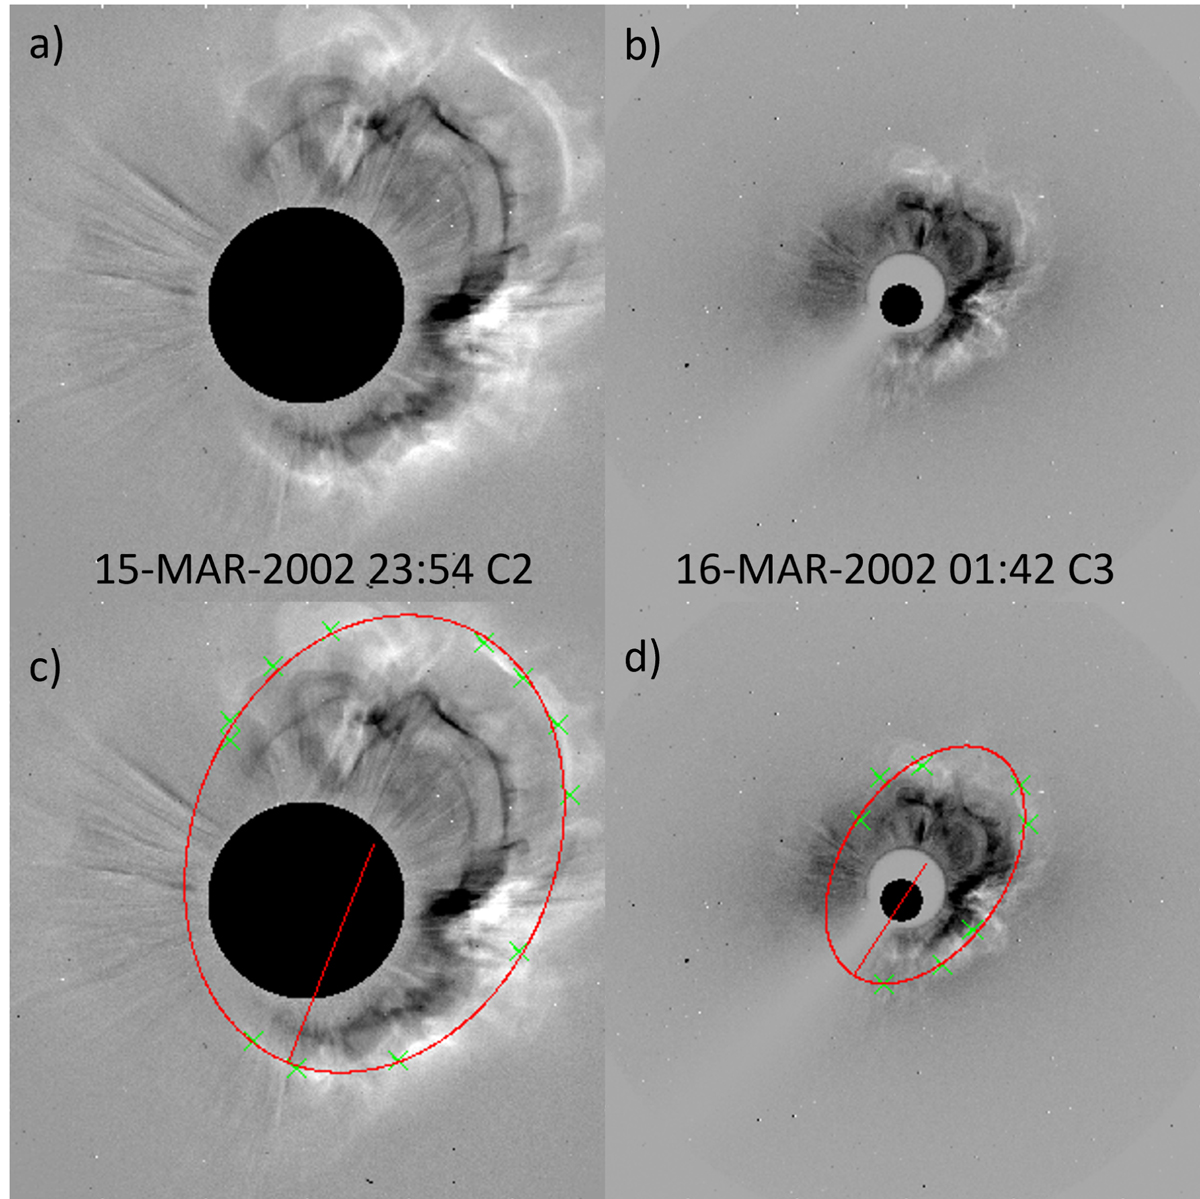
Coronal mass ejection that occurred on 15 March 2002. The upper panels show the running difference images in LASCO-C2 (left) and LASCO-C3 (right). The bottom panels show the corresponding ellipse fitting. The ellipse is indicated with a red line, whereas green crosses mark the points outlined on the CME front used to obtain the fit.
Current usage metrics show cumulative count of Article Views (full-text article views including HTML views, PDF and ePub downloads, according to the available data) and Abstracts Views on Vision4Press platform.
Data correspond to usage on the plateform after 2015. The current usage metrics is available 48-96 hours after online publication and is updated daily on week days.
Initial download of the metrics may take a while.