Fig. 2.
Download original image
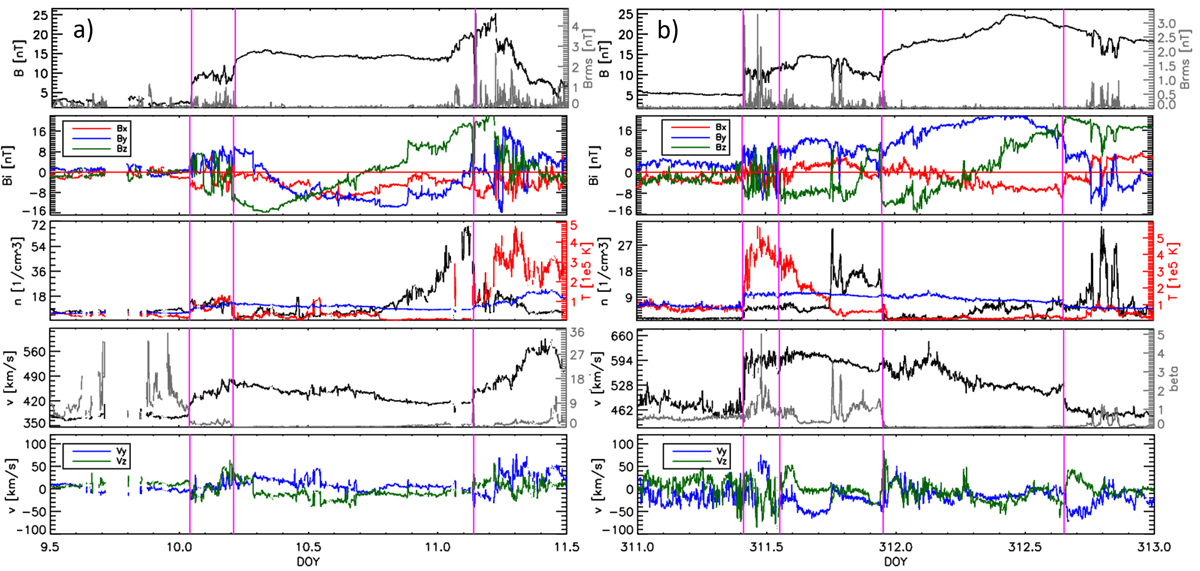
Interplanetary CME measured in situ on 10 January 1997 (left panels) and 3 November 2000 (right panels). From top to bottom, the following parameters are shown: Magnetic field magnitude in black and magnetic field fluctuations in gray (right scale); GSE magnetic field components (red, Bx; blue, By; green, Bz); proton density in black, temperature in red, and expected temperature in blue; solar wind speed in black and plasma beta parameter in gray; GSE velocity components (blue, By; green, Bz). From left to right, the vertical magenta lines mark the shock arrival, the end of the clear sheath, and the MO end time. In the right panels, the end of the clear sheath part does not coincide with the MO onset time, and there is an additional vertical magenta line present.
Current usage metrics show cumulative count of Article Views (full-text article views including HTML views, PDF and ePub downloads, according to the available data) and Abstracts Views on Vision4Press platform.
Data correspond to usage on the plateform after 2015. The current usage metrics is available 48-96 hours after online publication and is updated daily on week days.
Initial download of the metrics may take a while.