Fig. 9.
Download original image
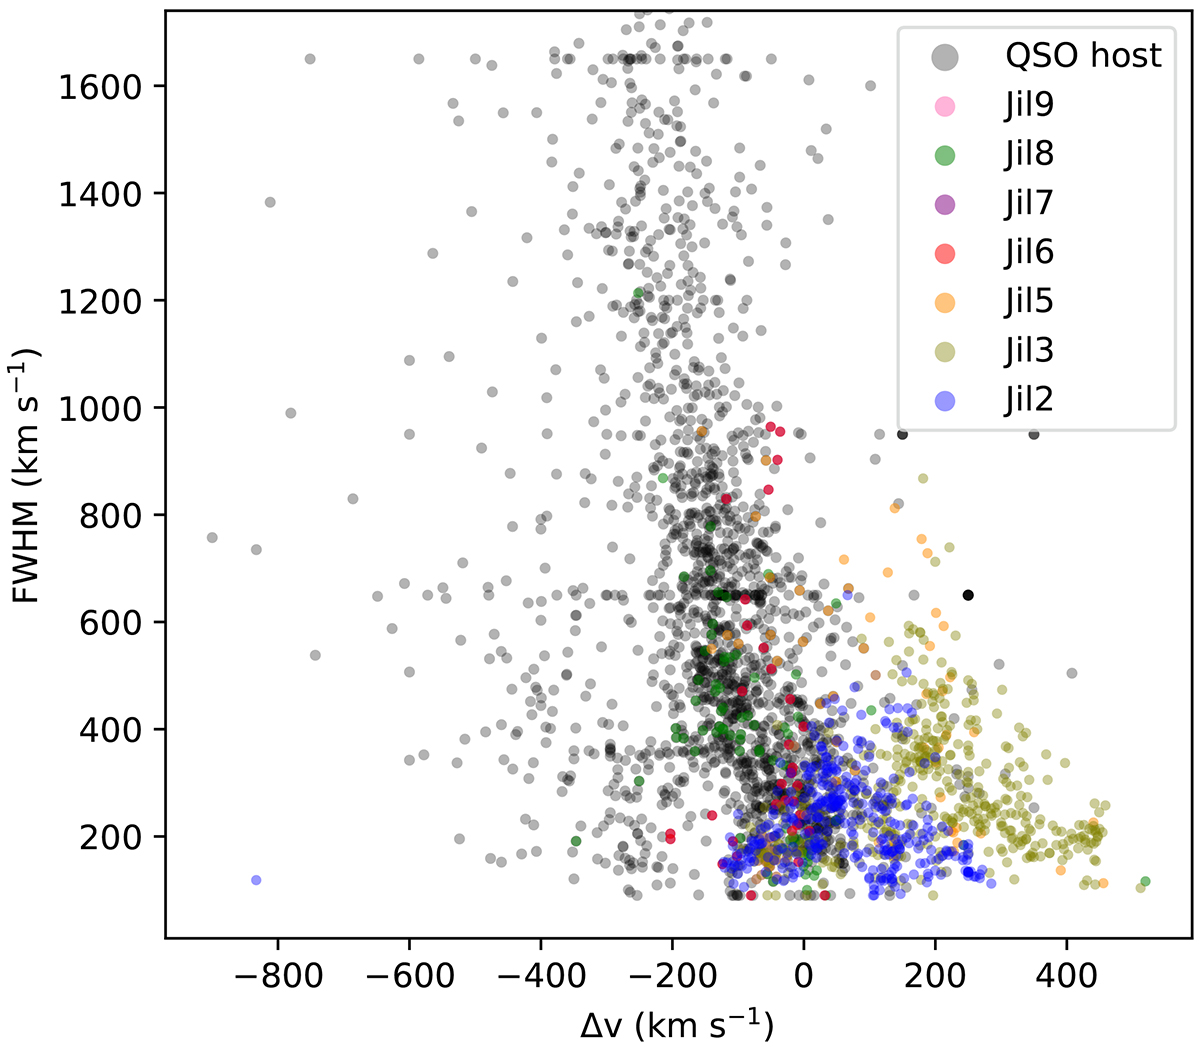
Velocity diagram for the individual Gaussian components used to model the emission line profiles in the data cube. Different colours are used to identify different targets in the NIRSpec FOV, as labelled.
Current usage metrics show cumulative count of Article Views (full-text article views including HTML views, PDF and ePub downloads, according to the available data) and Abstracts Views on Vision4Press platform.
Data correspond to usage on the plateform after 2015. The current usage metrics is available 48-96 hours after online publication and is updated daily on week days.
Initial download of the metrics may take a while.