Fig. 5.
Download original image
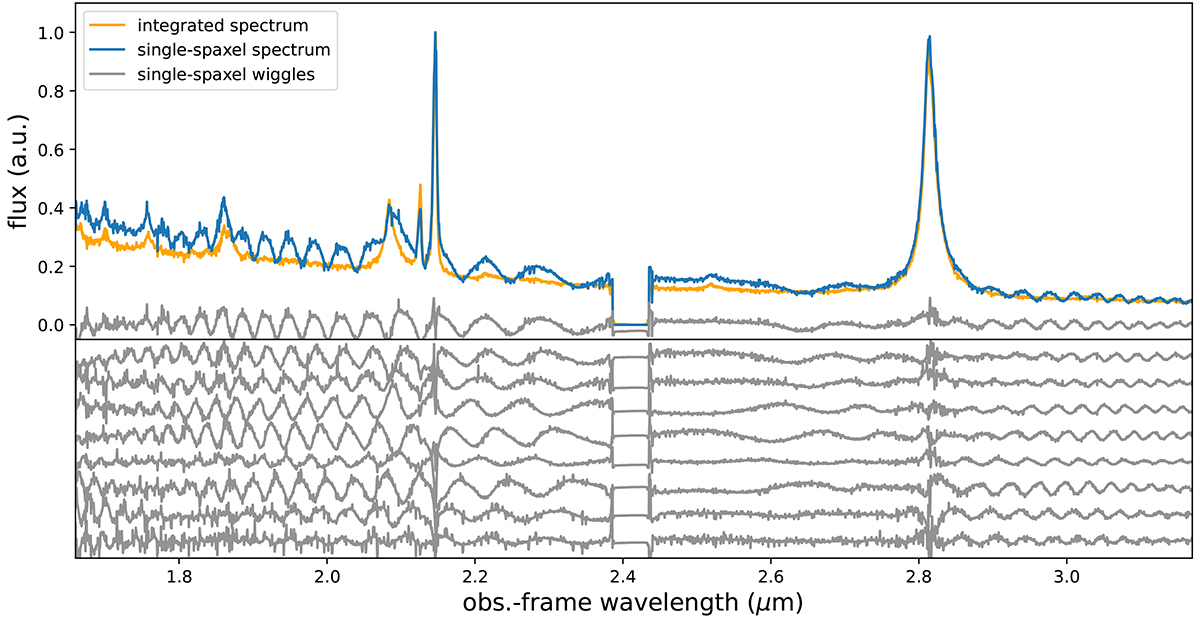
Sinusoidal-type patterns in single-spaxel spectra extracted from the drizzle data cube with a spaxel size of 0.05″. Top panel: LBQS 0302−0019 spectrum integrated over an aperture of r = 0.5″ (orange curve), in comparison with the spectrum of the brightest spaxel (blue curve). Both spectra are normalised to their maximum values, for visualisation purposes. The wiggles affecting the single-spaxel spectrum are reported in grey and are obtained as the difference between the blue and orange curves (after subtracting a low-order polynomial function that takes the differences in the continuum level into account). Bottom panel: wiggles obtained from the eight pixels closest to the brightest one. These wiggles strongly affect the shape of the continuum and, in particular, the Hβ profile and the wings of the [O III] lines. See Fig. B.1 for analogous effects in the emsm cube.
Current usage metrics show cumulative count of Article Views (full-text article views including HTML views, PDF and ePub downloads, according to the available data) and Abstracts Views on Vision4Press platform.
Data correspond to usage on the plateform after 2015. The current usage metrics is available 48-96 hours after online publication and is updated daily on week days.
Initial download of the metrics may take a while.