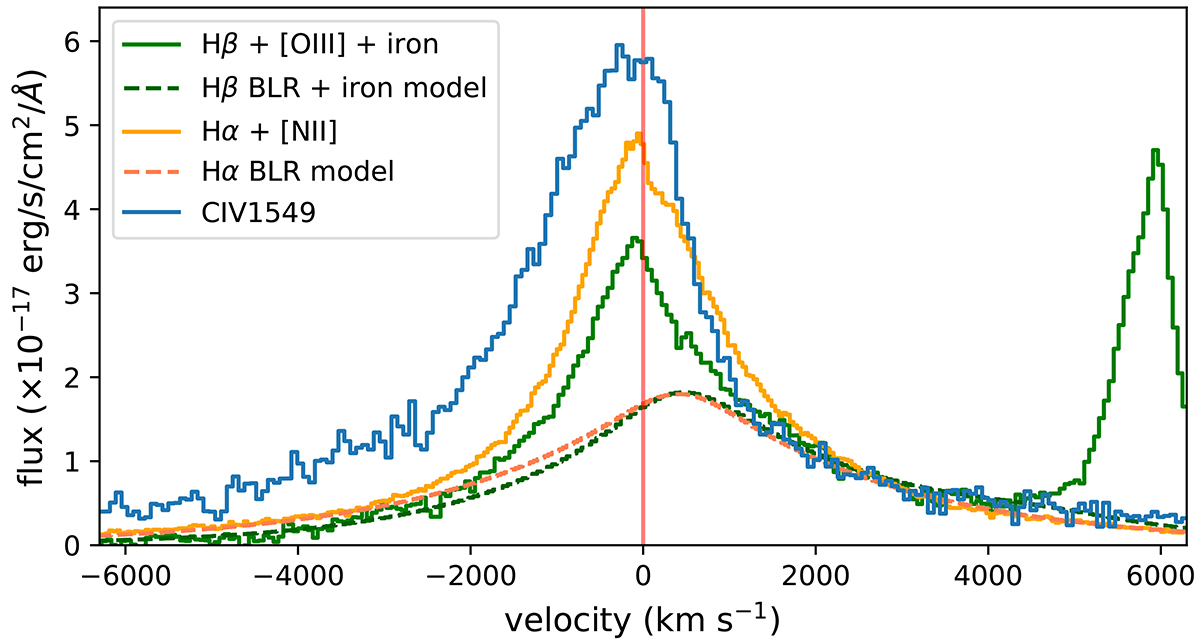
Fig. 4.
Download original image
Comparison of the BLR profiles of the C IV (from Shen 2016) and Hα and Hβ (from the integrated NIRSpec spectrum), in velocity space. For the Balmer lines, we also report the best-fit BLR profiles. All line profiles have been normalised to the flux of the BLR component in the reddest parts, which are likely less affected by BLR and NLR outflows. The C IV shows a significant excess in the blue part, at velocities of a few thousand km s−1, which is not observed in the Balmer lines or in the [O III] line. This excess possibly indicates strong BLR winds.
Current usage metrics show cumulative count of Article Views (full-text article views including HTML views, PDF and ePub downloads, according to the available data) and Abstracts Views on Vision4Press platform.
Data correspond to usage on the plateform after 2015. The current usage metrics is available 48-96 hours after online publication and is updated daily on week days.
Initial download of the metrics may take a while.