Fig. 3.
Download original image
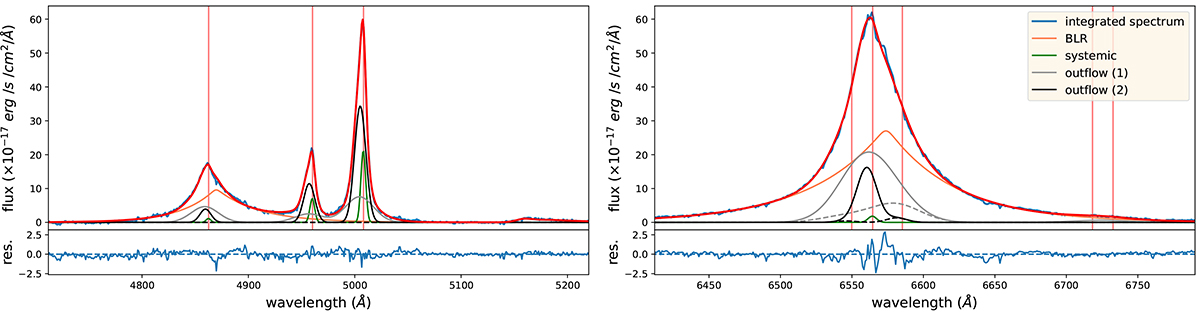
Multi-component simultaneous best-fit results for the continuum-subtracted spectrum of LBQS 0302−0019, around the Hβ–[O III] (left) and Hα–[N II] regions (right; integrated over a circular region with r = 0.5″). The blue curve represents the rest-frame NIRSpec spectrum, and the red curve indicates the best fit, with individual kinematic components shown with different colours (as labelled in the right panel). For the outflow (1) and (2) components, we also show the contribution from the only [N II] lines with dashed lines, as the grey and black curves do not allow a clear distinction between the Hα and [N II] line transitions. Vertical red lines indicate the most prominent emission lines, as in Fig. 2. The lower panels show the residual to the model fit, that is, the difference between the observed spectrum and the model.
Current usage metrics show cumulative count of Article Views (full-text article views including HTML views, PDF and ePub downloads, according to the available data) and Abstracts Views on Vision4Press platform.
Data correspond to usage on the plateform after 2015. The current usage metrics is available 48-96 hours after online publication and is updated daily on week days.
Initial download of the metrics may take a while.