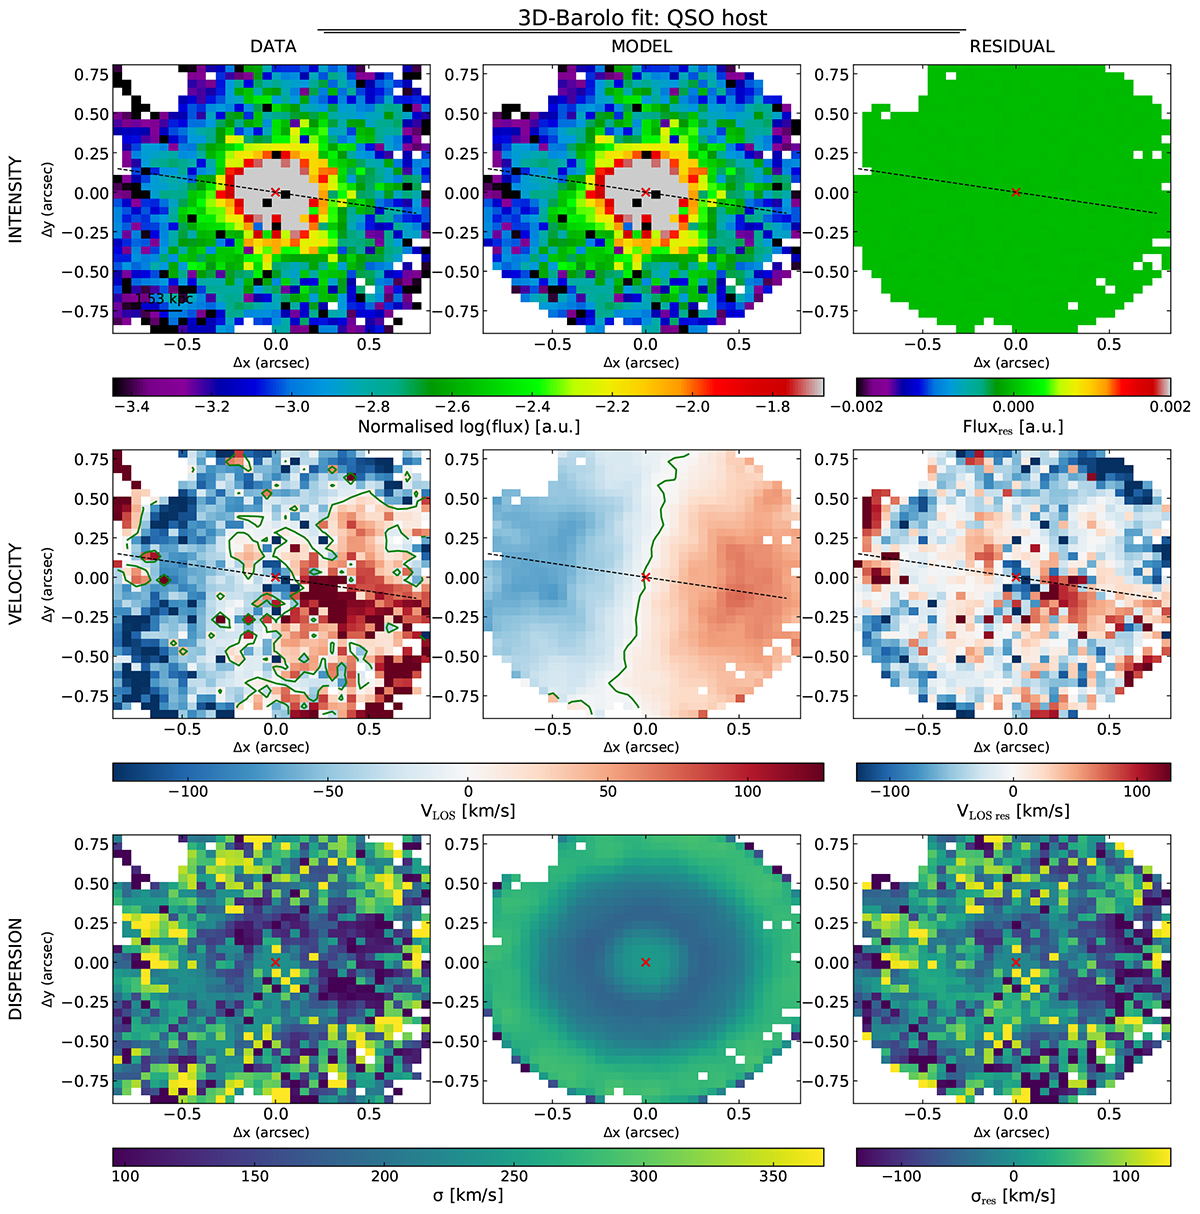
Fig. C.1.
Download original image
LBQS 0302−0019 host galaxy disk kinematic best fit of Moment 0, 1, and 2 (first to third rows). These best fits are inferred from the analysis of the narrow [O III] component obtained from our multi-component Gaussian fit (i.e. all components with FWHM < 600 km s−1 in Fig. 9). The black and green lines identify the major axis and the zero-velocity curve, respectively; the red cross identifies the QSO position.
Current usage metrics show cumulative count of Article Views (full-text article views including HTML views, PDF and ePub downloads, according to the available data) and Abstracts Views on Vision4Press platform.
Data correspond to usage on the plateform after 2015. The current usage metrics is available 48-96 hours after online publication and is updated daily on week days.
Initial download of the metrics may take a while.