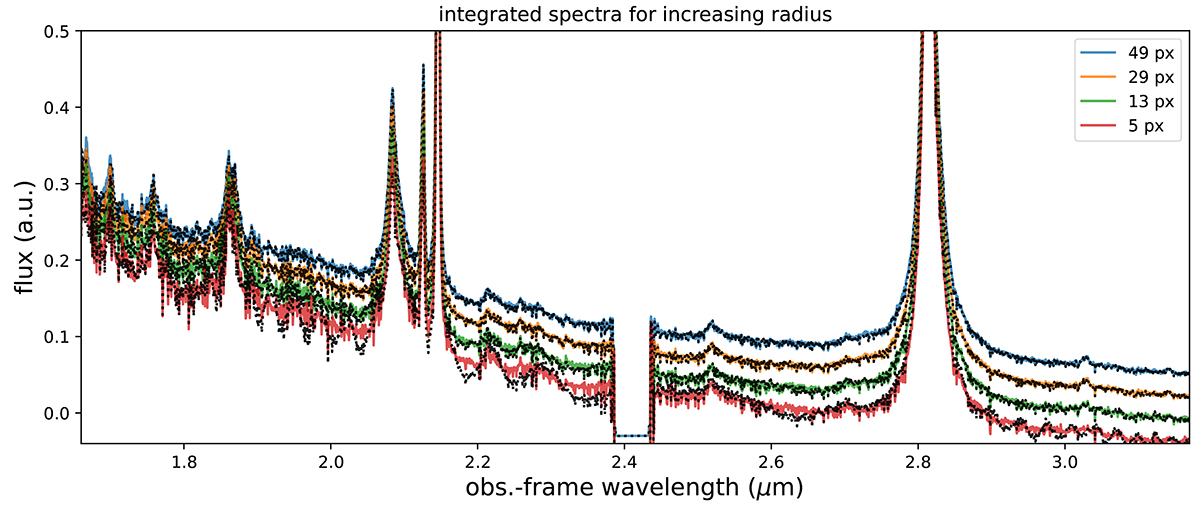
Fig. B.6.
Download original image
Integrated spectra extracted from circular regions containing 5 to 49 spaxels (corresponding to radii of 2 to 5 spaxels), centred on the LBQS 0302−0019 nucleus (from the drizzle cubes with spaxels of 0.05″). The solid lines show the spectra after the wiggle subtraction, while the dotted lines show the original spectra. All spectra are normalised to the peak of [O III]; for those extracted from regions with radii < 5 spaxels, we added vertical offsets to ease the visualisation. The figure proves that our correction preserves the integrated fluxes and the shape of the spectrum.
Current usage metrics show cumulative count of Article Views (full-text article views including HTML views, PDF and ePub downloads, according to the available data) and Abstracts Views on Vision4Press platform.
Data correspond to usage on the plateform after 2015. The current usage metrics is available 48-96 hours after online publication and is updated daily on week days.
Initial download of the metrics may take a while.