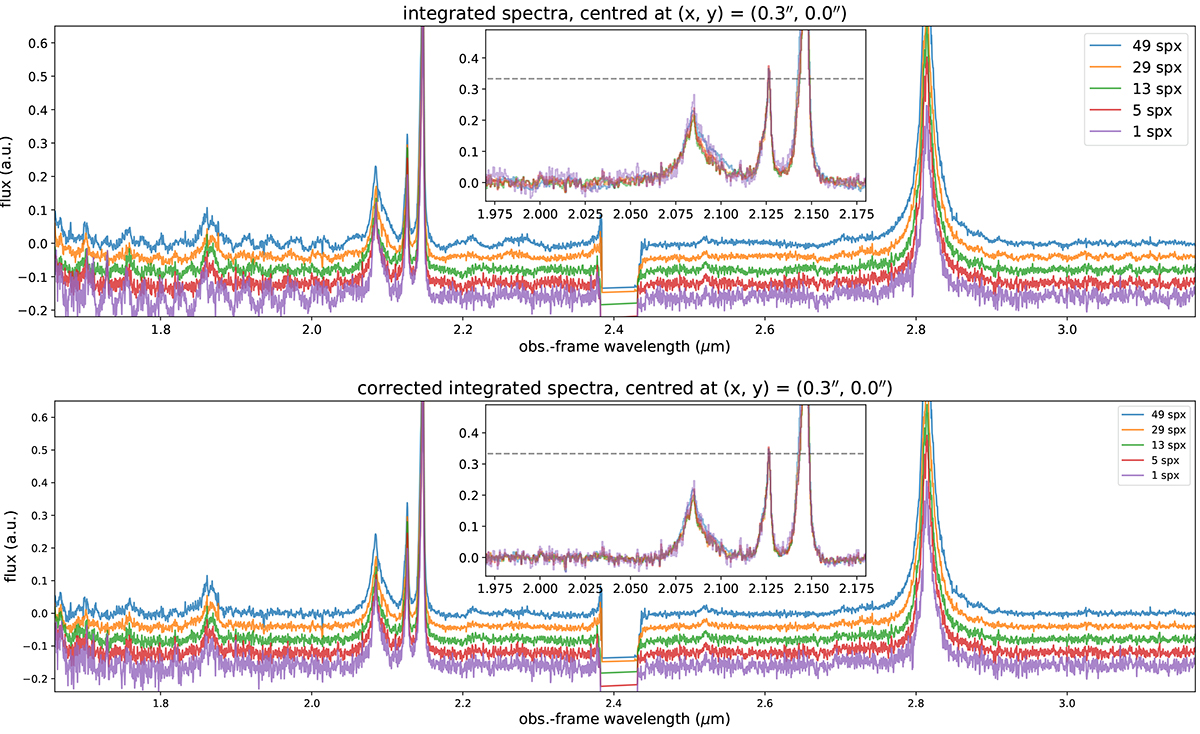
Fig. B.5.
Download original image
Integrated spectra extracted from circular regions containing 1 to 49 spaxels (corresponding to radii of 1 to 5 spaxels), centred at 0.3″ east of the LBQS 0302−0019 nucleus (from the drizzle cubes with spaxels of 0.05″). The top panel shows the original spectra, while the bottom panel shows the same spectra after the correction for the wiggles at the spaxel level (Sect. 5.1). All spectra are continuum-subtracted and are normalised to the peak of [O III]; for those extracted from regions with radii < 5 spaxels, we added vertical offsets to ease the visualisation. The insets show a zoomed-in view of the vicinity of the [O III] and Hβ lines, without any vertical offset; these spectra show that the [O III]λ4959 peaks at ∼0.33 (indicated by the horizontal dashed line), consistent with theoretical expectations.
Current usage metrics show cumulative count of Article Views (full-text article views including HTML views, PDF and ePub downloads, according to the available data) and Abstracts Views on Vision4Press platform.
Data correspond to usage on the plateform after 2015. The current usage metrics is available 48-96 hours after online publication and is updated daily on week days.
Initial download of the metrics may take a while.