Fig. 2.
Download original image
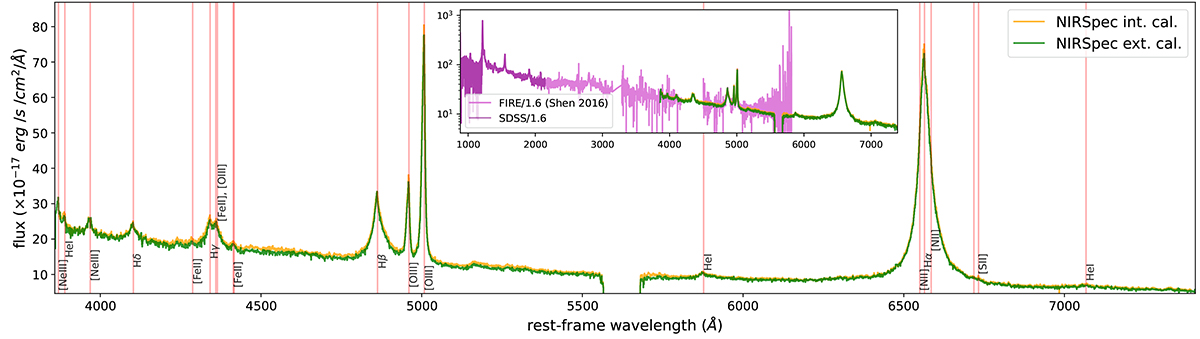
NIRSpec spectra obtained with internal (orange curve) and external (green) flux calibration and integrated over a region of r = 1.5″. The two NIRSpec spectra are extracted from the drizzle cubes, with 0.05″ spaxels. Vertical lines indicate the main emission line features detected in the NIRSpec spectrum. The inset shows the same NIRSpec spectra compared with the Magellan/FIRE (magenta) and the SDSS (purple) spectra, rescaled by a factor of 1.6 to match the NIRSpec spectra in the vicinity of the Hβ and [O III] lines.
Current usage metrics show cumulative count of Article Views (full-text article views including HTML views, PDF and ePub downloads, according to the available data) and Abstracts Views on Vision4Press platform.
Data correspond to usage on the plateform after 2015. The current usage metrics is available 48-96 hours after online publication and is updated daily on week days.
Initial download of the metrics may take a while.