Fig. B.2.
Download original image
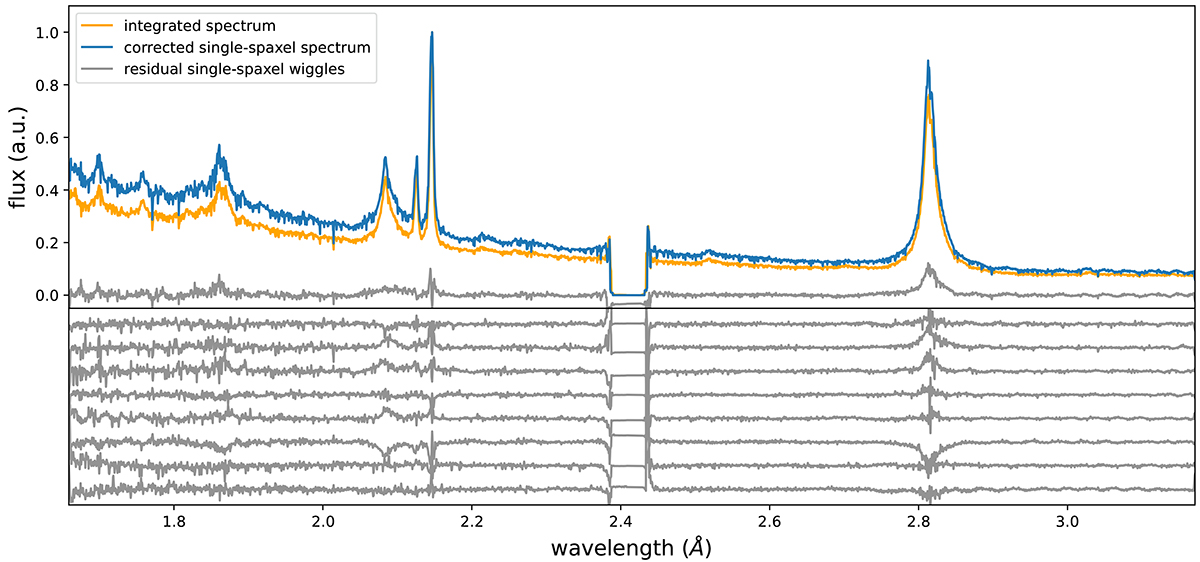
Wiggle-corrected spectra extracted from the emsm data cube with a spaxel size of 0.1″. Top panel: LBQS 0302−0019 spectrum integrated over an aperture of r = 0.5″ (orange curve), in comparison with the spectrum of the brightest spaxel, after the wiggle subtraction (blue curve). Both spectra are normalised to 1 for visualisation purposes. The residuals are reported in grey and are obtained as the difference between the blue and orange curves (see Fig. 5 for details). Bottom panel: Residuals obtained from the eight spaxels closest to the brightest one. The most significant residuals are found at the position of the brightest emission lines: they are not due to the wiggles, but to the line profile variations.
Current usage metrics show cumulative count of Article Views (full-text article views including HTML views, PDF and ePub downloads, according to the available data) and Abstracts Views on Vision4Press platform.
Data correspond to usage on the plateform after 2015. The current usage metrics is available 48-96 hours after online publication and is updated daily on week days.
Initial download of the metrics may take a while.