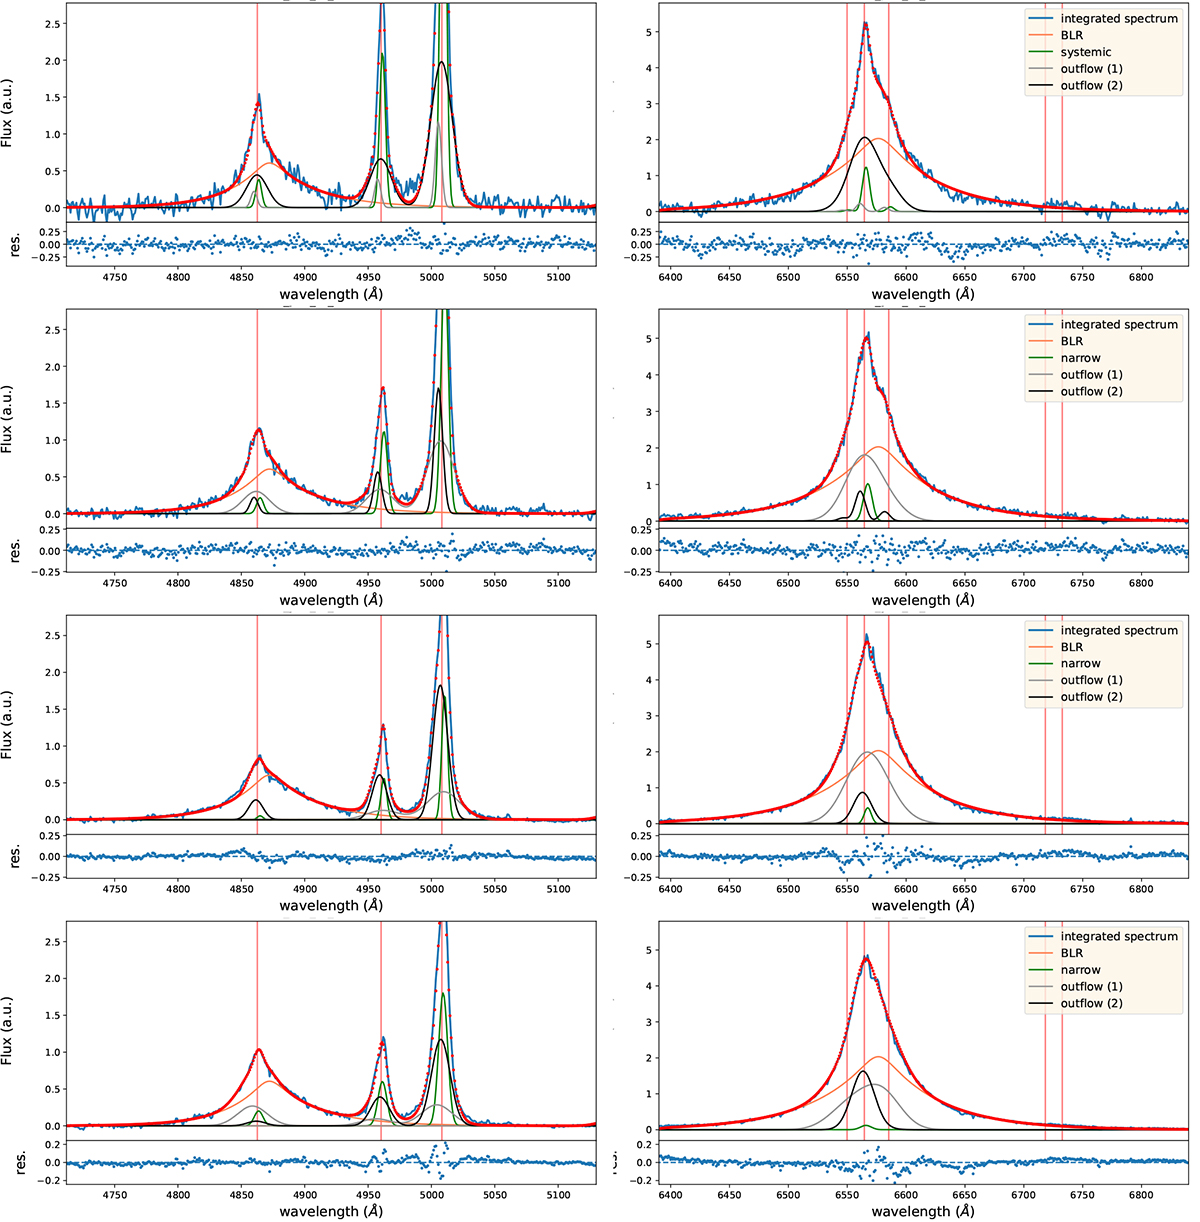
Fig. A.1.
Download original image
Integrated spectra extracted from circular regions with a radius of 0.2″ and centred at different positions within a few spaxels of the peak emission of the QSO. The best-fit models shown here were obtained by fitting the four spectra with the same BLR profiles, as explained in Sect. 4.
Current usage metrics show cumulative count of Article Views (full-text article views including HTML views, PDF and ePub downloads, according to the available data) and Abstracts Views on Vision4Press platform.
Data correspond to usage on the plateform after 2015. The current usage metrics is available 48-96 hours after online publication and is updated daily on week days.
Initial download of the metrics may take a while.