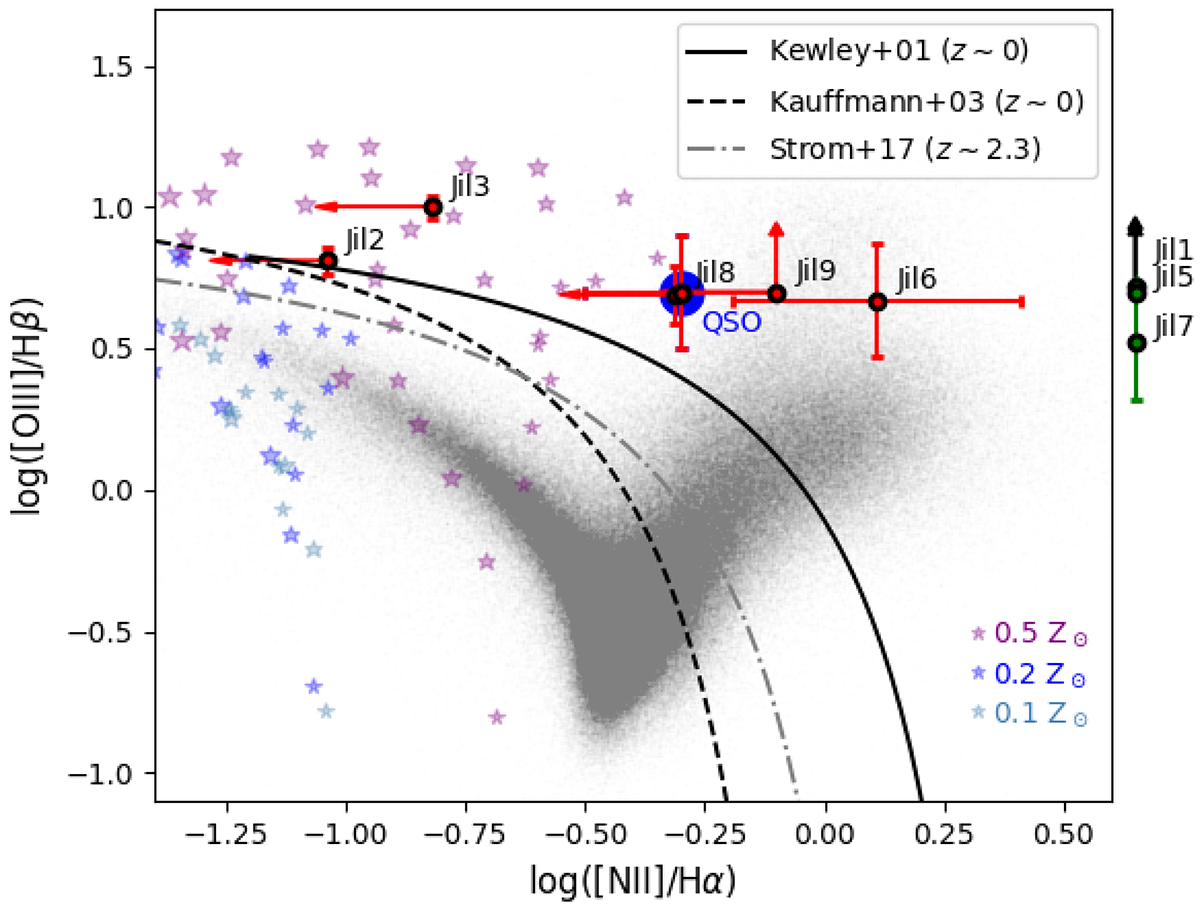
Fig. 14.
Download original image
BPT diagnostic diagram. Red points represent flux ratios inferred from the integrated Jil spectra, while the blue point indicates the QSO host ratios. For Jil1, Jil5, and Jil7, [O III]/Hβ ratios are reported outside of the BPT, as Hα and [N II] are undetected for these companions. Local galaxies from SDSS DR7 (Abazajian et al. 2009) are indicated in grey, while small stars represent model predictions for low-metallicity AGN from Nakajima & Maiolino (2022, see this paper for a plethora of physical parameters related to gas and AGN properties, such as ionisation and accretion disk temperature), as labelled. The dashed line indicates the demarcation by Kauffmann et al. (2003) between star-forming galaxies (left) and AGN (right) at low z; the solid line from Kewley et al. (2001) includes more extreme starbursts and composite objects among the star-forming galaxies at low z; the dot-dashed grey line from Strom et al. (2017) shows the locus of star-forming galaxies at z ∼ 2.
Current usage metrics show cumulative count of Article Views (full-text article views including HTML views, PDF and ePub downloads, according to the available data) and Abstracts Views on Vision4Press platform.
Data correspond to usage on the plateform after 2015. The current usage metrics is available 48-96 hours after online publication and is updated daily on week days.
Initial download of the metrics may take a while.