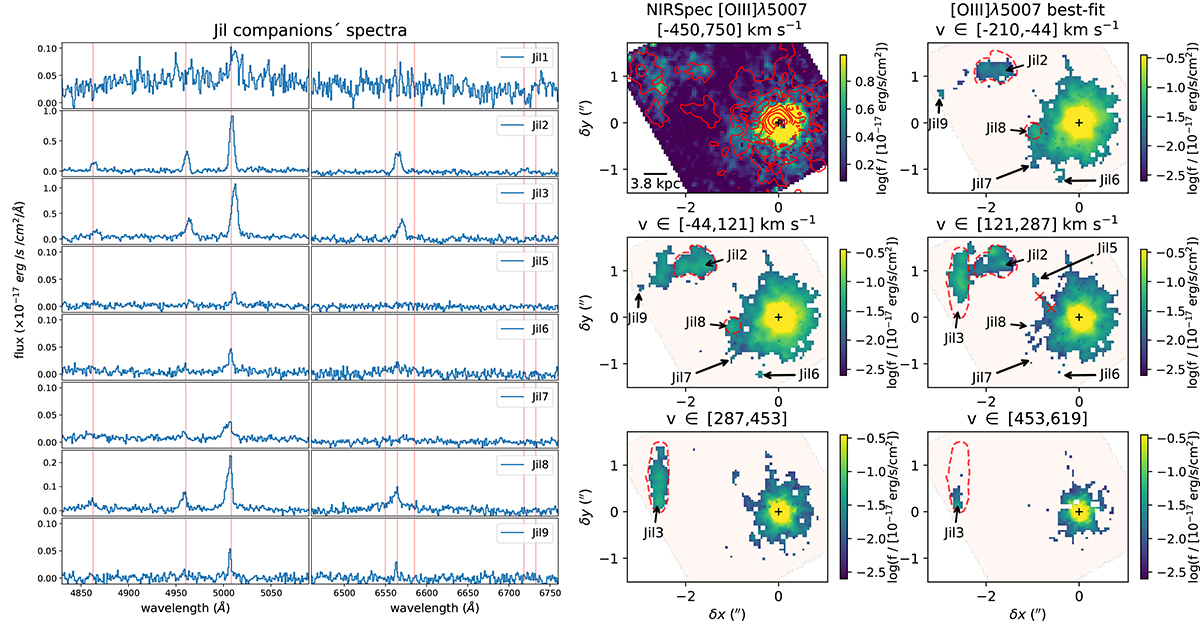
Fig. 12.
Download original image
Jil spectra and spatial distribution. Left panels: Jil companions’ spectra. Jil2, Jil3, and Jil8 spectra have been obtained by integrating over the entire extension of the targets (with [O III] detected above 8σ). For the remaining sources, we considered 3 × 3 spaxel integration (Jil5, Jil6, Jil7, and Jil9), or 5 × 5 spaxels (Jil1). All profiles are relatively narrow and redshifted with respect to the QSO systemic; this ensures that we are not affected by PSF contamination. The continuum emission is never detected; the continuum observed in the Jil1 spectrum is likely due to data reduction artefacts. Right panels: [O III] flux distributions, obtained by integrating over different velocity channels. The top-left panel has been obtained by integrating over a large velocity range, using the QSO NLR+BLR-subtracted cube (Sect. 5.3); all other velocity channel maps have been extracted from the best-fit [O III] profiles. The top-left panel shows the HST contours presented in Husemann et al. (2021); all remaining panels show the Jil companions, as detected in NIRSpec. The dashed red lines identify the regions from which the integrated Jil2, Jil3, and Jil8 spectra, reported on the left part of the figure, have been extracted.
Current usage metrics show cumulative count of Article Views (full-text article views including HTML views, PDF and ePub downloads, according to the available data) and Abstracts Views on Vision4Press platform.
Data correspond to usage on the plateform after 2015. The current usage metrics is available 48-96 hours after online publication and is updated daily on week days.
Initial download of the metrics may take a while.