Fig. D.1.
Download original image
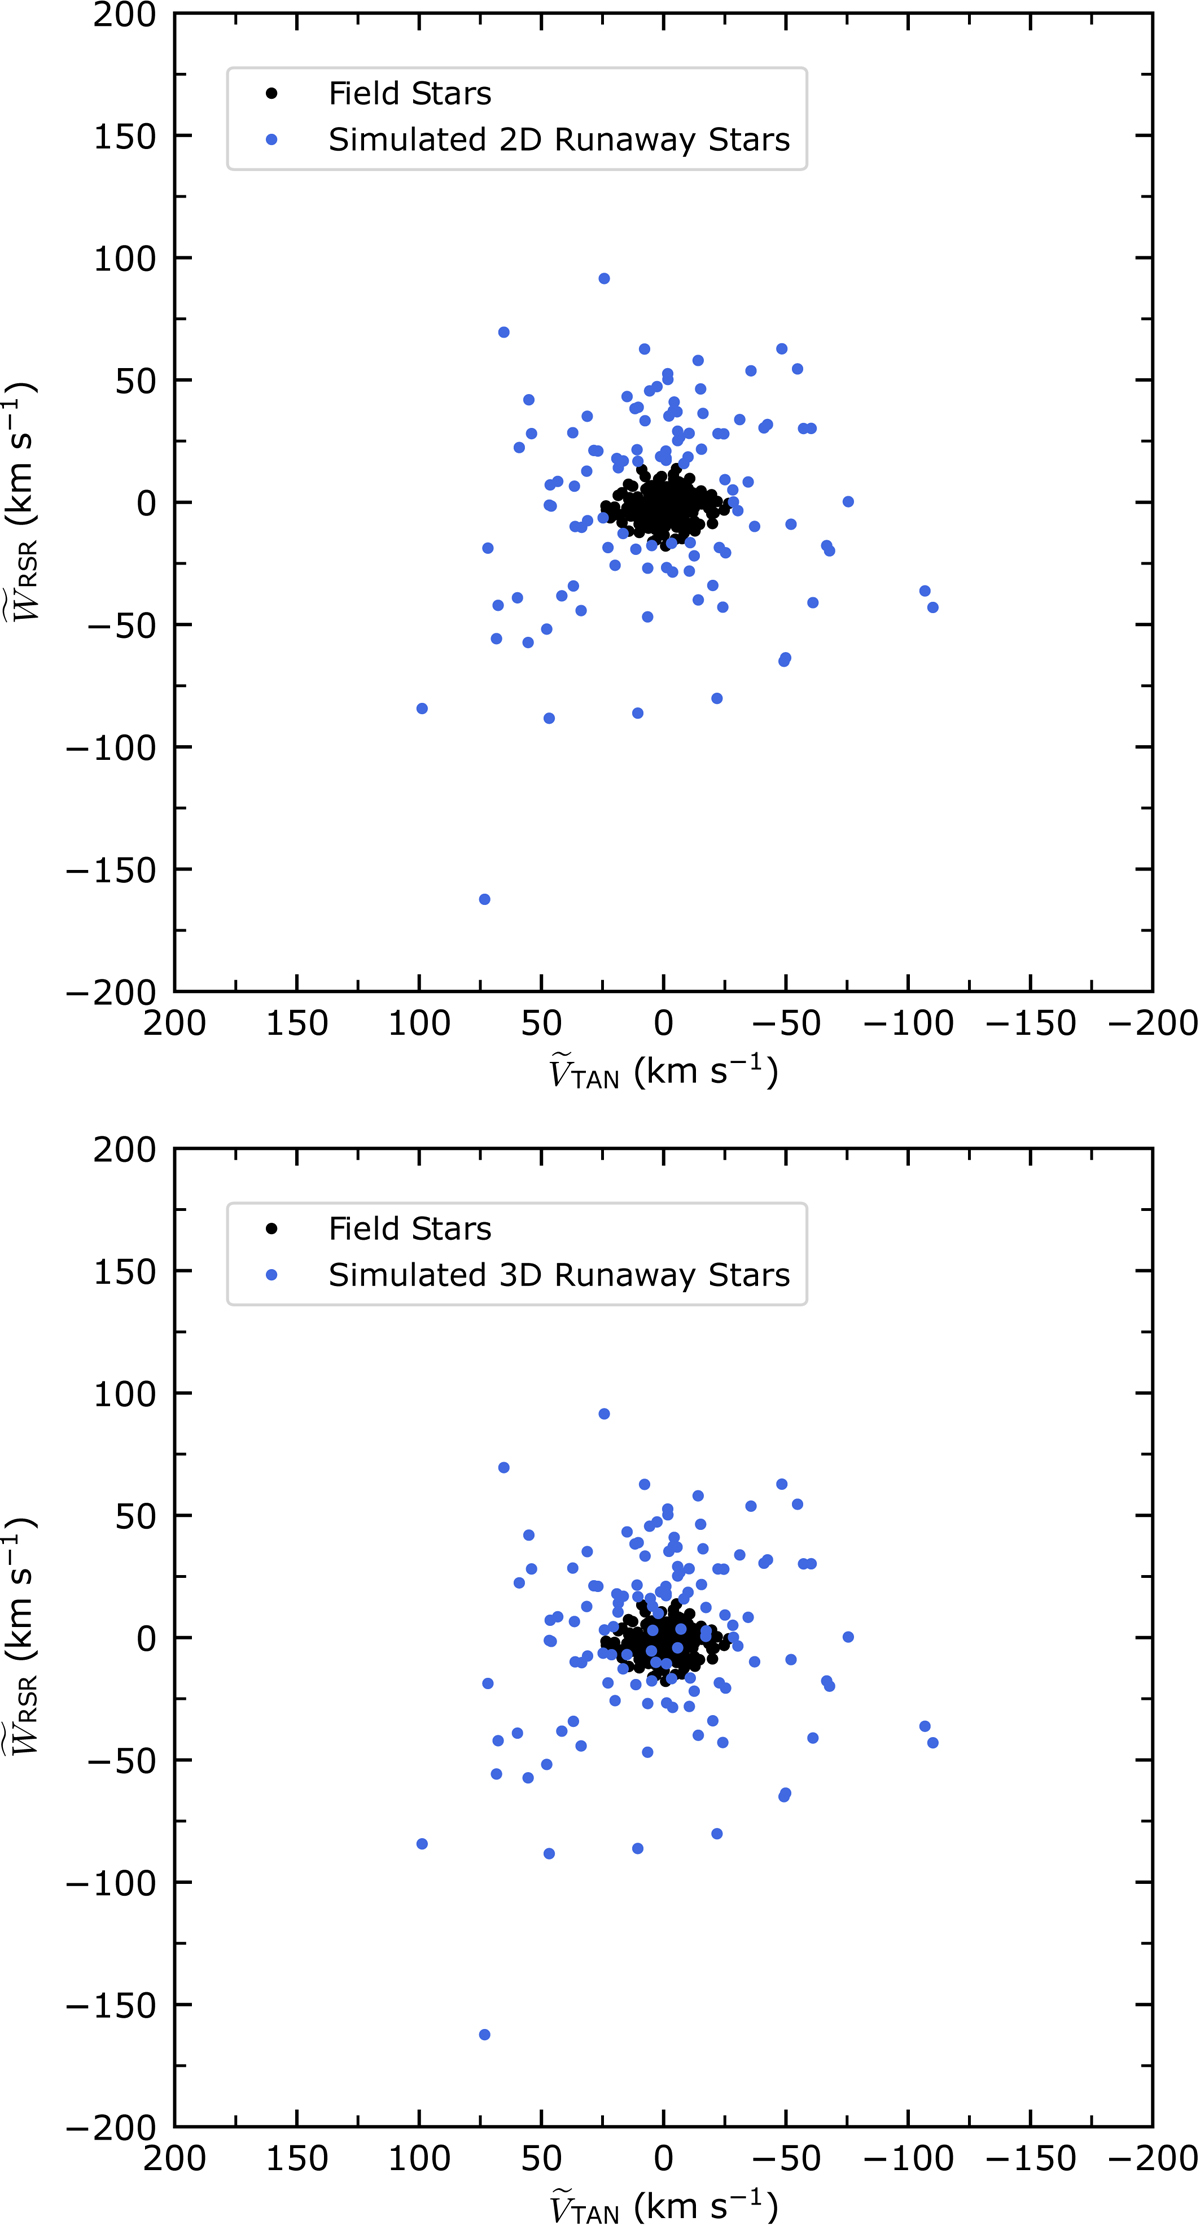
![]() as a function of
as a function of ![]() for the simulated runaway stars represented in blue for one of the 10000 simulations that match the GOSC-Gaia DR3 results. The (VTAN,WRSR) velocities of the field stars of the GOSC-Gaia DR3 catalog are depicted in black. Top: Simulated 2D runaway stars. Bottom: Simulated 3D runaway stars with either positive or negative values of
for the simulated runaway stars represented in blue for one of the 10000 simulations that match the GOSC-Gaia DR3 results. The (VTAN,WRSR) velocities of the field stars of the GOSC-Gaia DR3 catalog are depicted in black. Top: Simulated 2D runaway stars. Bottom: Simulated 3D runaway stars with either positive or negative values of ![]() .
.
Current usage metrics show cumulative count of Article Views (full-text article views including HTML views, PDF and ePub downloads, according to the available data) and Abstracts Views on Vision4Press platform.
Data correspond to usage on the plateform after 2015. The current usage metrics is available 48-96 hours after online publication and is updated daily on week days.
Initial download of the metrics may take a while.