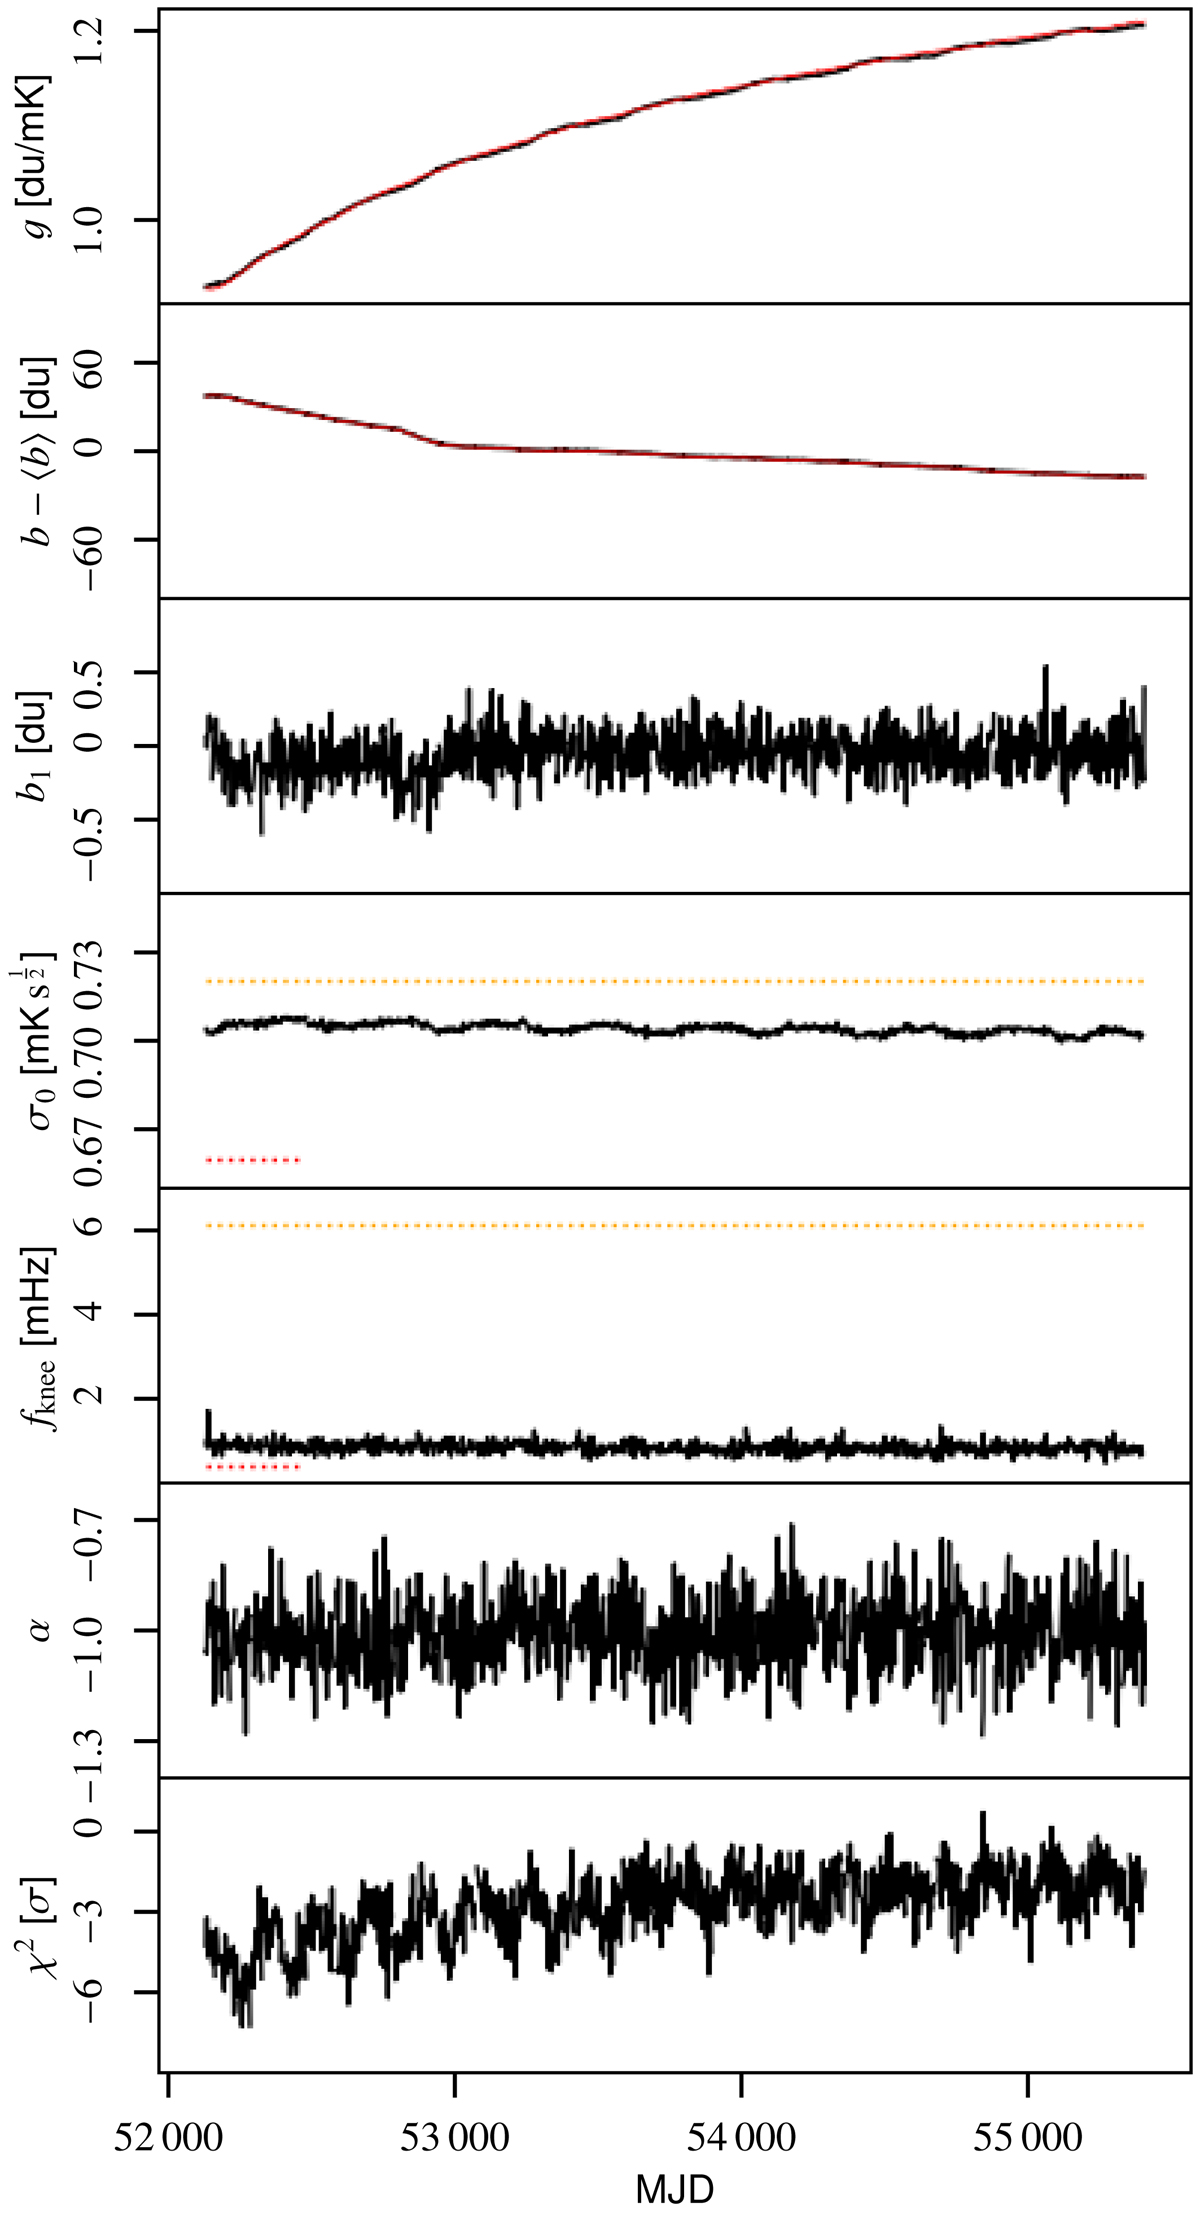
Fig. 6.
Download original image
Overview of K113. The red solid lines in the first and second panel are the regressed gain and baseline from WMAP9, while the black lines in all panels are posterior means from the COSMOGLOBE Gibbs chain. The red dashed and yellow dashed lines are reported σ0 and fknee values from the first-year WMAP data analysis and GSFC measurements, respectively.
Current usage metrics show cumulative count of Article Views (full-text article views including HTML views, PDF and ePub downloads, according to the available data) and Abstracts Views on Vision4Press platform.
Data correspond to usage on the plateform after 2015. The current usage metrics is available 48-96 hours after online publication and is updated daily on week days.
Initial download of the metrics may take a while.