Fig. 43.
Download original image
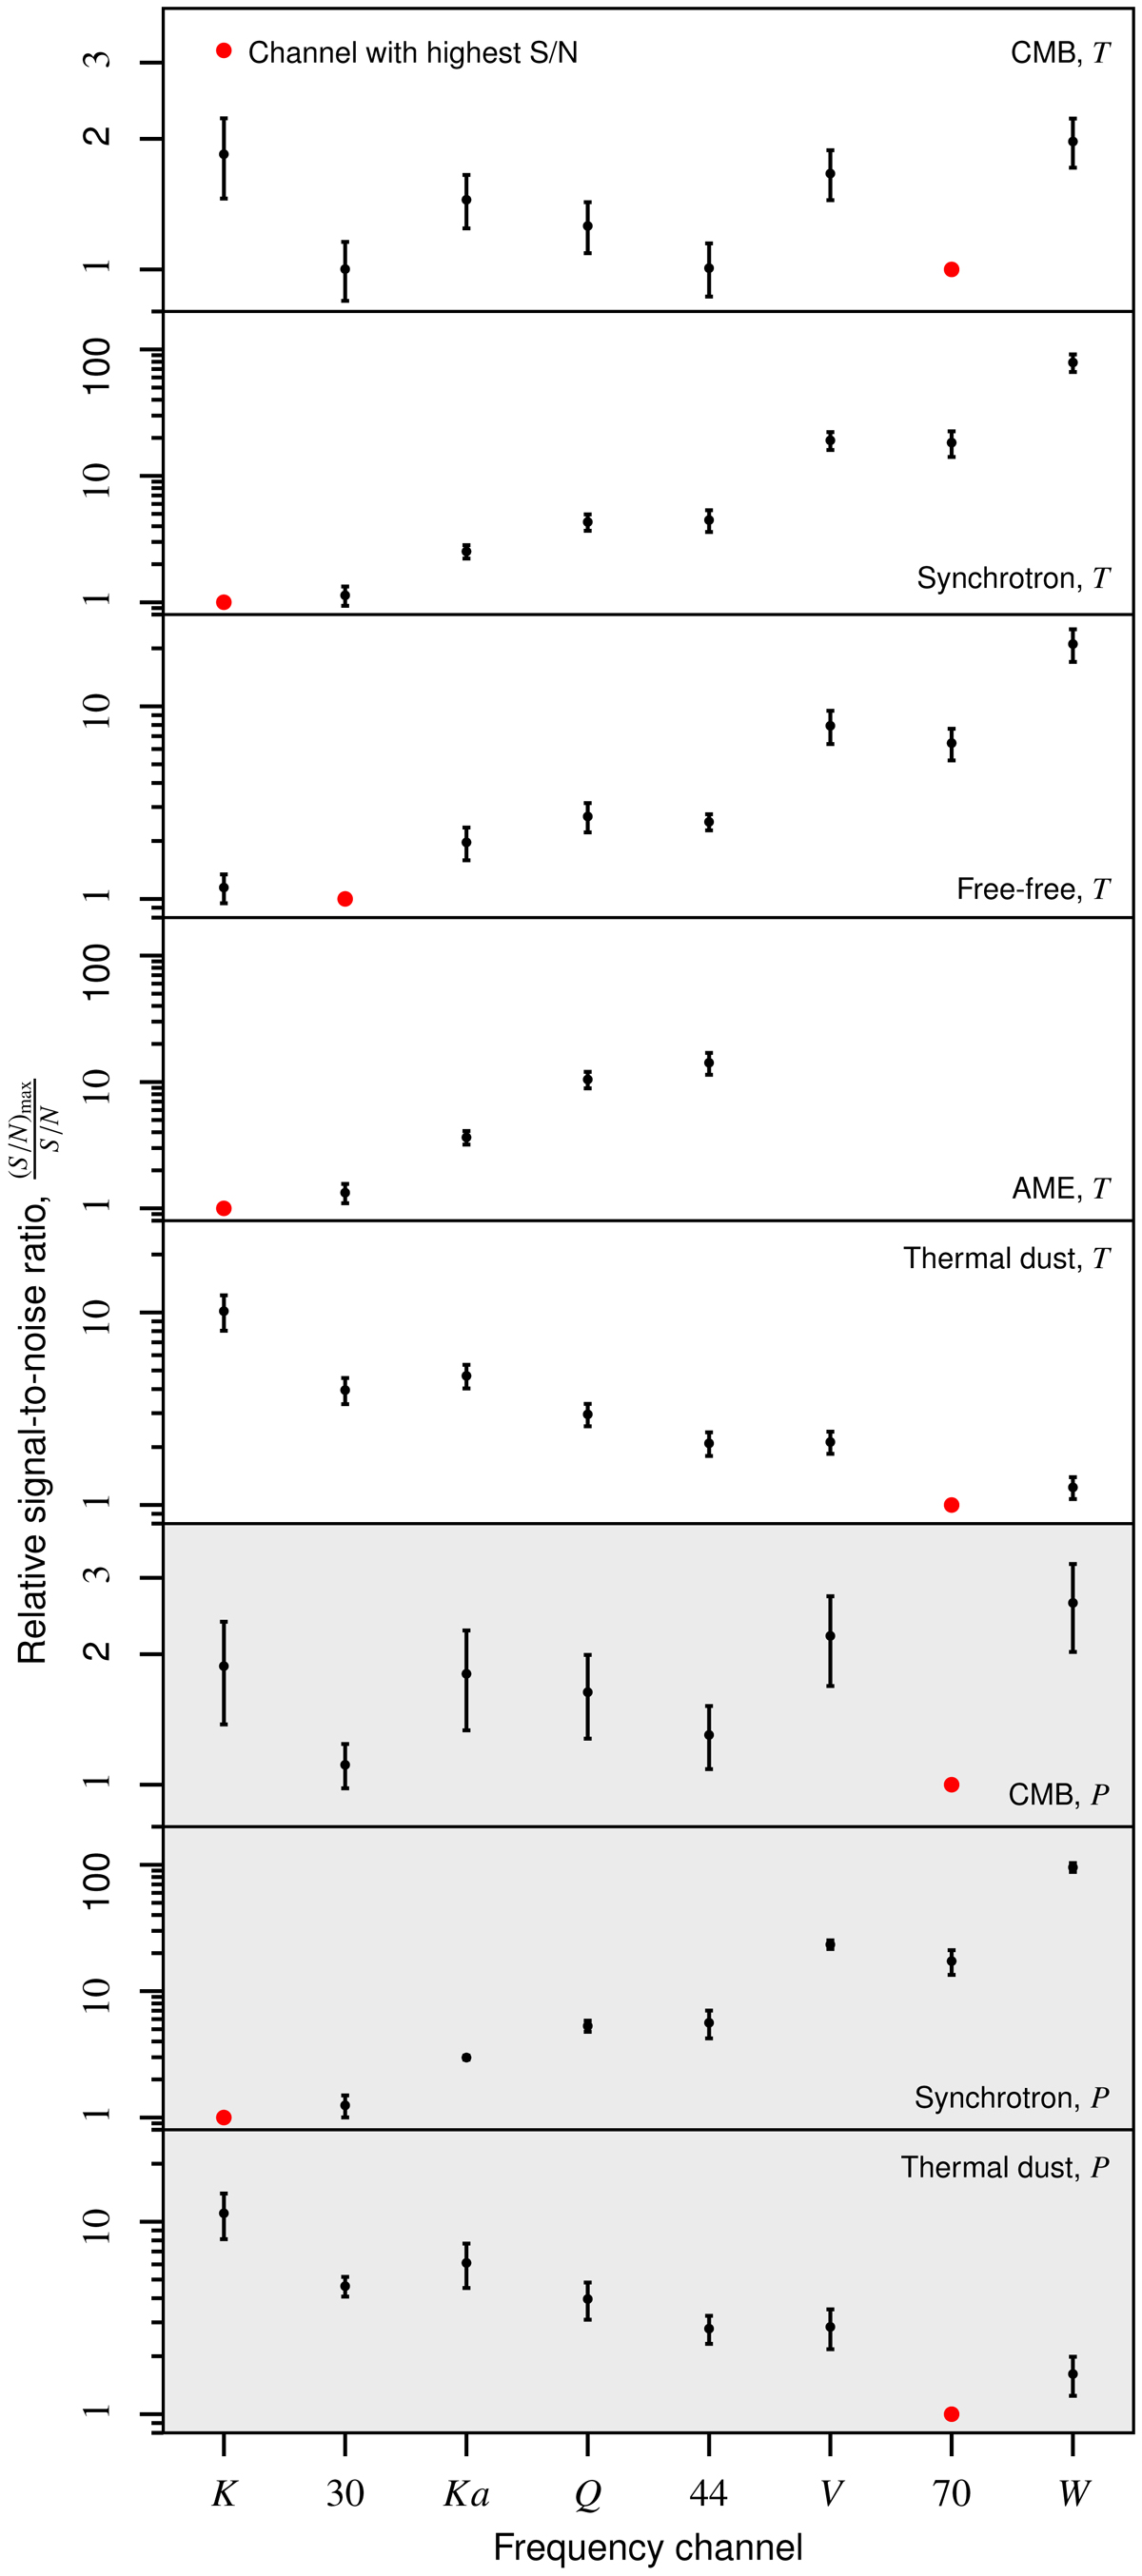
Relative signal-to-noise ratios for WMAP and LFI channels and various components, as defined in terms of the ratio between the mixing matrix and the total instrumental uncertainty, ψ = M/σ. The total instrumental uncertainty is derived by adding the white noise and instrumental uncertainty maps (as given by Figs. B.2 and B.3) in quadrature. Values are reported as the ratio between the most sensitive channel (marked by a red dot) and the given channel; points with error bars correspond to mean and standard deviations evaluated over the full sky. Panels with white background indicate intensity results, while panels with gray background indicates polarization results. All quantities are evaluated at a common angular resolution of 2° FWHM.
Current usage metrics show cumulative count of Article Views (full-text article views including HTML views, PDF and ePub downloads, according to the available data) and Abstracts Views on Vision4Press platform.
Data correspond to usage on the plateform after 2015. The current usage metrics is available 48-96 hours after online publication and is updated daily on week days.
Initial download of the metrics may take a while.