Fig. 35.

Download original image
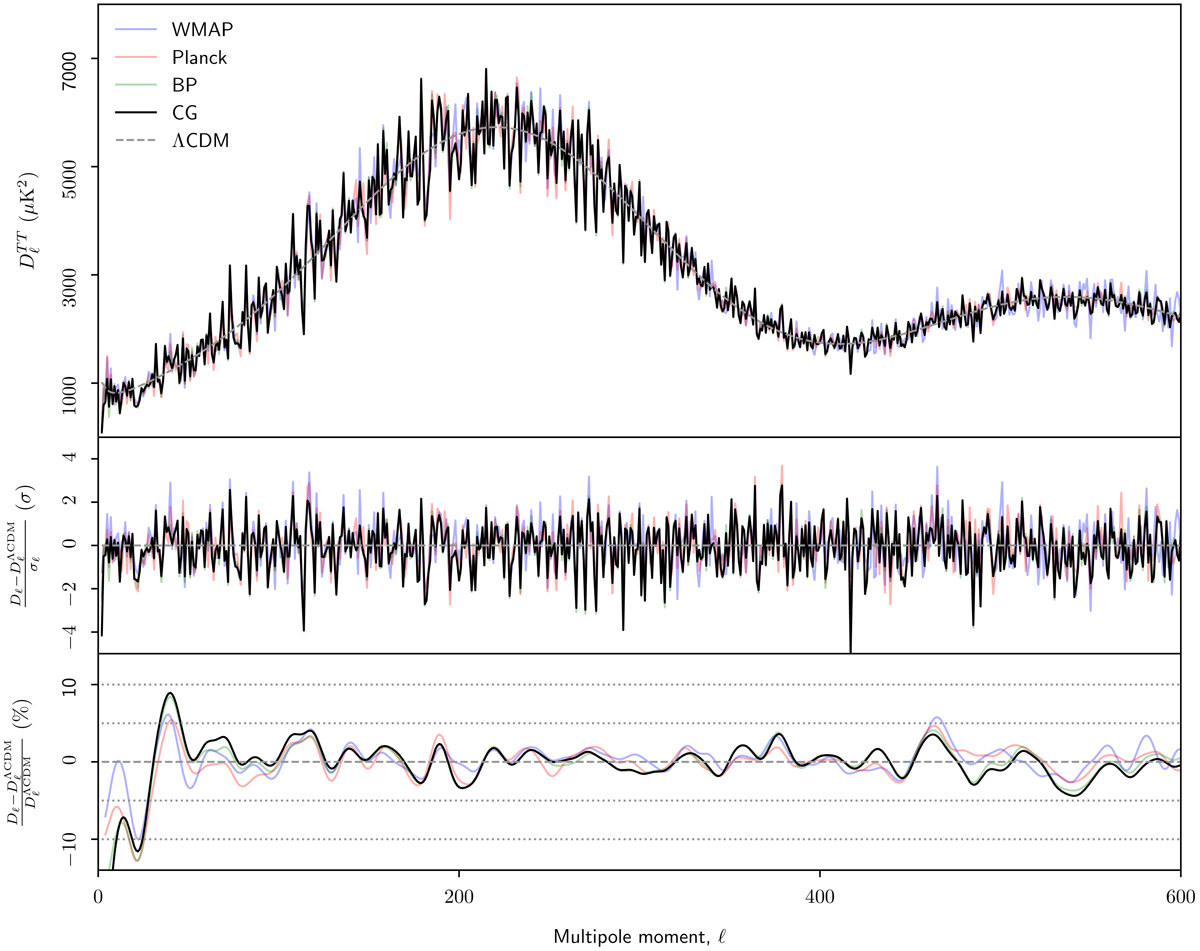
Top: angular CMB temperature power spectrum, ![]() , as derived by COSMOGLOBE (black), BEYONDPLANCK (green), Planck (red), and WMAP9 (blue). The best-fit Planck 2018 ΛCDM spectrum is showed in dashed gray. Middle: residual power spectrum relative to ΛCDM, measured relative to the quoted error bars,
, as derived by COSMOGLOBE (black), BEYONDPLANCK (green), Planck (red), and WMAP9 (blue). The best-fit Planck 2018 ΛCDM spectrum is showed in dashed gray. Middle: residual power spectrum relative to ΛCDM, measured relative to the quoted error bars, ![]() . For pipelines that report asymmetric error bars, σℓ is taken to be the average of the upper and lower error bar. Bottom: fractional difference with respect to the PlanckΛCDM spectrum. In this panel, each curve has been boxcar averaged with a window of Δℓ = 100 to suppress random fluctuations.
. For pipelines that report asymmetric error bars, σℓ is taken to be the average of the upper and lower error bar. Bottom: fractional difference with respect to the PlanckΛCDM spectrum. In this panel, each curve has been boxcar averaged with a window of Δℓ = 100 to suppress random fluctuations.
Current usage metrics show cumulative count of Article Views (full-text article views including HTML views, PDF and ePub downloads, according to the available data) and Abstracts Views on Vision4Press platform.
Data correspond to usage on the plateform after 2015. The current usage metrics is available 48-96 hours after online publication and is updated daily on week days.
Initial download of the metrics may take a while.


