Open Access
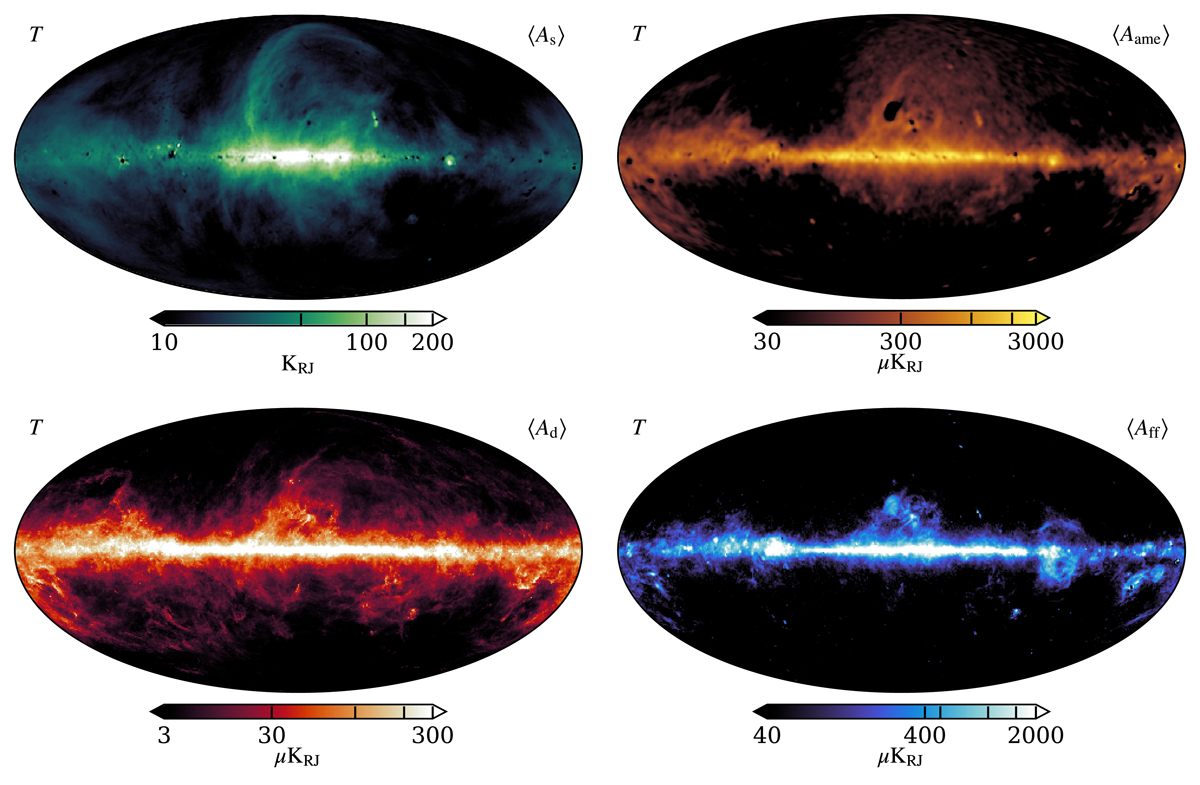
Fig. 29.
Download original image
Foreground intensity maps, evaluated at their respective reference frequencies. Top left: synchrotron emission evaluated at 408 MHz. Top right: anomalous microwave emission evaluated at 22 GHz. Bottom left: Free–free emission at 40 GHz. Bottom right: thermal dust emission at 70 GHz.
Current usage metrics show cumulative count of Article Views (full-text article views including HTML views, PDF and ePub downloads, according to the available data) and Abstracts Views on Vision4Press platform.
Data correspond to usage on the plateform after 2015. The current usage metrics is available 48-96 hours after online publication and is updated daily on week days.
Initial download of the metrics may take a while.