Fig. 27.
Download original image
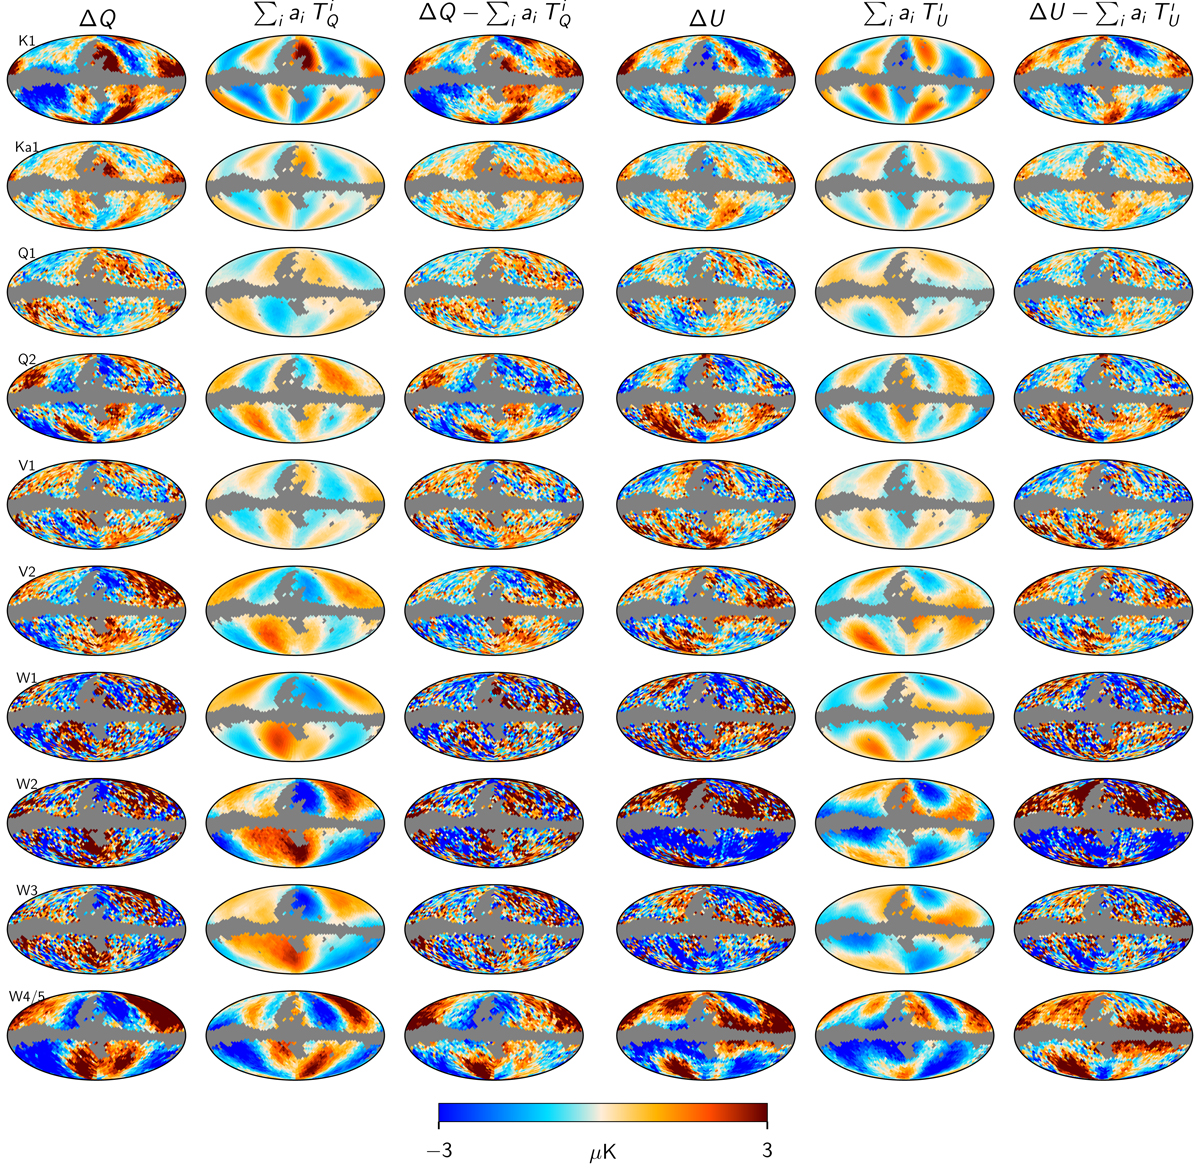
Efficiency assessment of the WMAP approach for transmission imbalance error propagation. The left and right sections of the figure correspond to Stokes Q and U parameters, respectively, while rows show different DAs. Within each section, the left panel shows the raw difference between the WMAP9 and COSMOGLOBE DA maps, while the middle panel shows the best-fit WMAP transmission imbalance template combination; the right panel shows the difference between the two. Only one template amplitude is fit for both Q and U.
Current usage metrics show cumulative count of Article Views (full-text article views including HTML views, PDF and ePub downloads, according to the available data) and Abstracts Views on Vision4Press platform.
Data correspond to usage on the plateform after 2015. The current usage metrics is available 48-96 hours after online publication and is updated daily on week days.
Initial download of the metrics may take a while.