Fig. 25.
Download original image
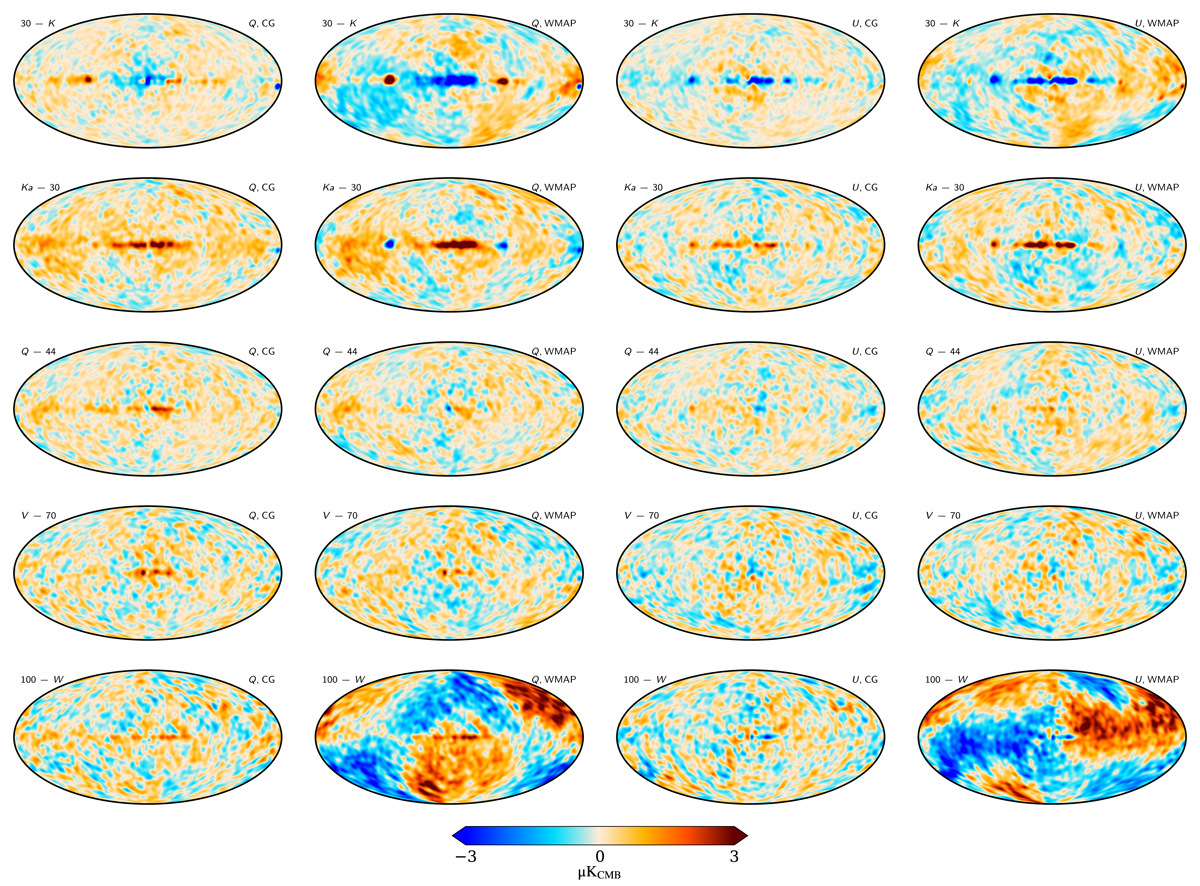
Difference maps between similar WMAP and Planck frequency maps. The comparison plots go, by column: Stokes Q for the COSMOGLOBE-produced WMAP and Planck sky maps, Stokes Q for official WMAP and BEYONDPLANCK data products, Stokes U for the COSMOGLOBE sky maps, and Stokes U for the official data products. Top row: WMAP LFI 30 GHz minus K-band, scaled by the synchrotron power-law. Top middle row: WMAP Ka-band minus LFI 30 GHz, also scaled by the synchrotron power-law. Middle row: WMAP Q-band compared to the LFI 44 GHz sky maps, scaled by the synchrotron power-law. Bottom middle row: WMAP V-band minus LFI 70 GHz, with unit scalings for each band. Bottom row: Planck DR4 100 GHz map minus the WMAP W-band also with unit scalings for each band.
Current usage metrics show cumulative count of Article Views (full-text article views including HTML views, PDF and ePub downloads, according to the available data) and Abstracts Views on Vision4Press platform.
Data correspond to usage on the plateform after 2015. The current usage metrics is available 48-96 hours after online publication and is updated daily on week days.
Initial download of the metrics may take a while.