Open Access
Fig. 24.
Download original image
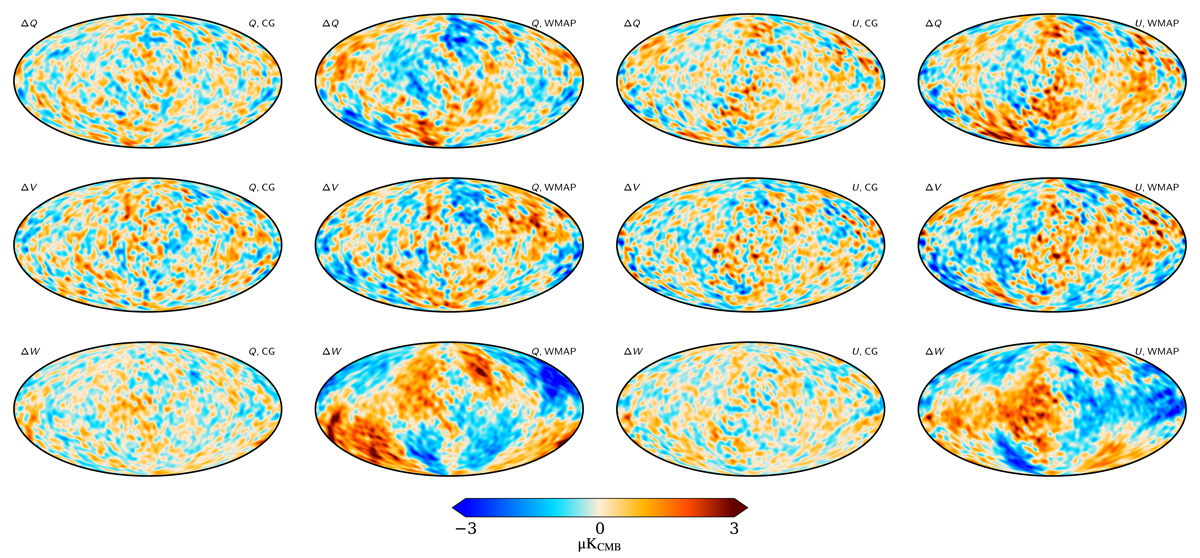
Internal WMAP difference maps, smoothed by 10°. The two left columns are Stokes Q, and the two right columns are Stokes U, with the COSMOGLOBE and WMAP9 maps alternating between columns. The top to bottom rows are difference maps in increasing frequency.
Current usage metrics show cumulative count of Article Views (full-text article views including HTML views, PDF and ePub downloads, according to the available data) and Abstracts Views on Vision4Press platform.
Data correspond to usage on the plateform after 2015. The current usage metrics is available 48-96 hours after online publication and is updated daily on week days.
Initial download of the metrics may take a while.