Open Access
Fig. 20.
Download original image
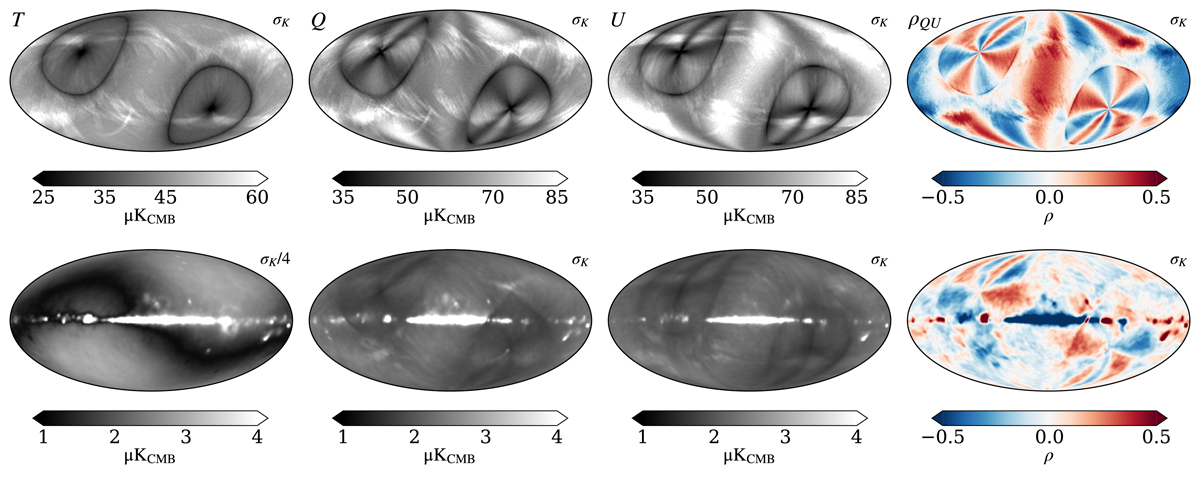
Posterior variation maps for K-band. Columns show the Stokes parameters and the correlation coefficient between Q and U, while the rows show (top) the white noise rms per pixel and (bottom) the posterior standard deviation. The rms maps are unsmoothed, while the standard deviations have been smoothed to 7°.
Current usage metrics show cumulative count of Article Views (full-text article views including HTML views, PDF and ePub downloads, according to the available data) and Abstracts Views on Vision4Press platform.
Data correspond to usage on the plateform after 2015. The current usage metrics is available 48-96 hours after online publication and is updated daily on week days.
Initial download of the metrics may take a while.