Fig. 2.
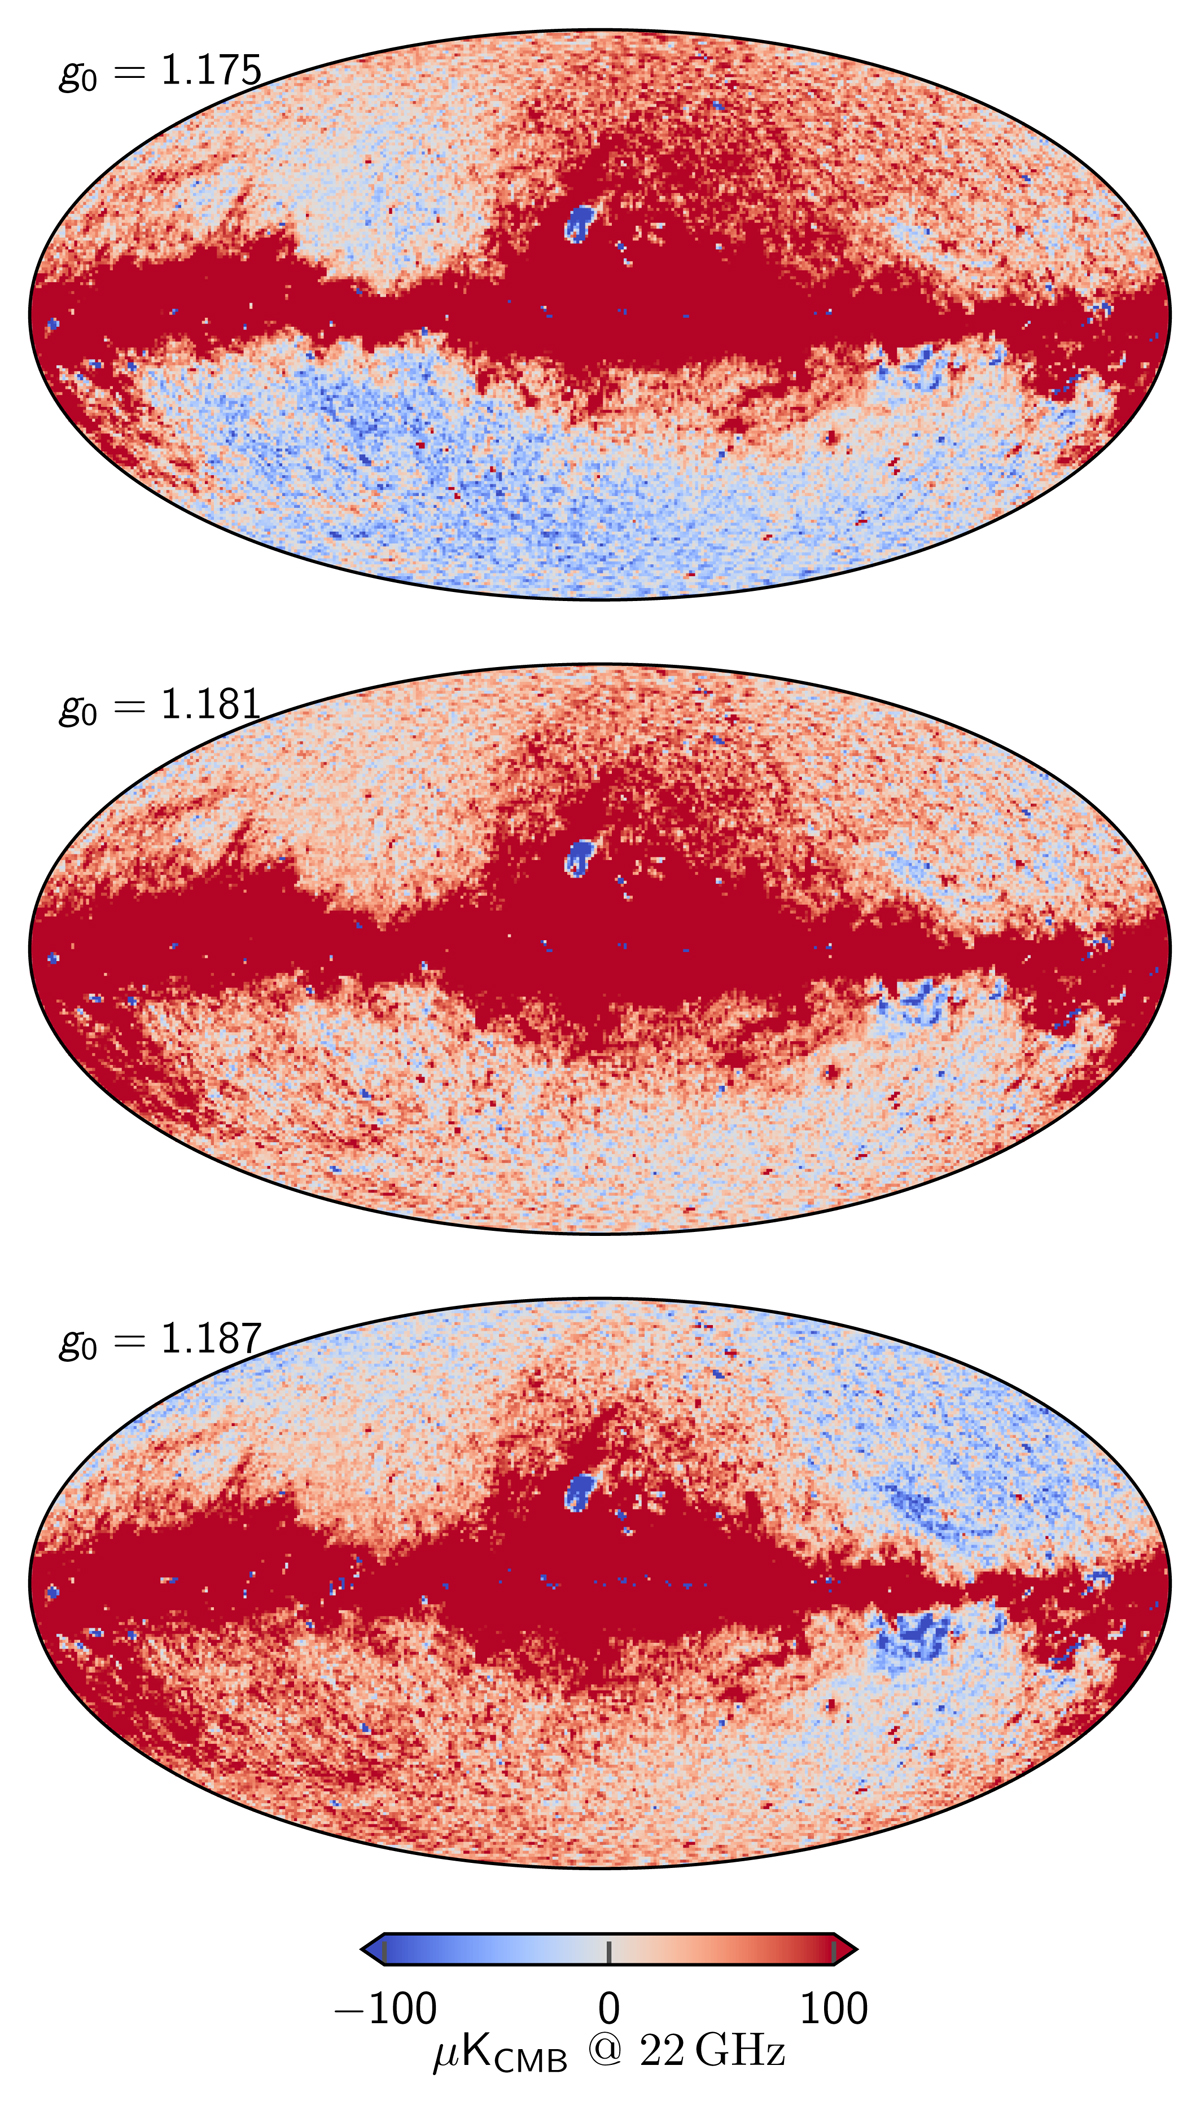
Download original image
Dependence of AME amplitude evaluated at 22 GHz on the absolute calibration. Each map comes from the fifth iteration of a dedicated Commander3 run that fixed g0 while letting all other TOD parameters be fit. The values of g0 = 1.175 and g0 = 1.187 represent 6σ draws from the prior distribution with mean 1.181 and standard deviation 0.001. Extreme outliers were chosen to illustrate this effect. The dipole visible in the top and bottom panels is aligned perfectly with the Solar dipole, and is directly due to variations in the K-band absolute calibration.
Current usage metrics show cumulative count of Article Views (full-text article views including HTML views, PDF and ePub downloads, according to the available data) and Abstracts Views on Vision4Press platform.
Data correspond to usage on the plateform after 2015. The current usage metrics is available 48-96 hours after online publication and is updated daily on week days.
Initial download of the metrics may take a while.