Open Access
Fig. 14.
Download original image
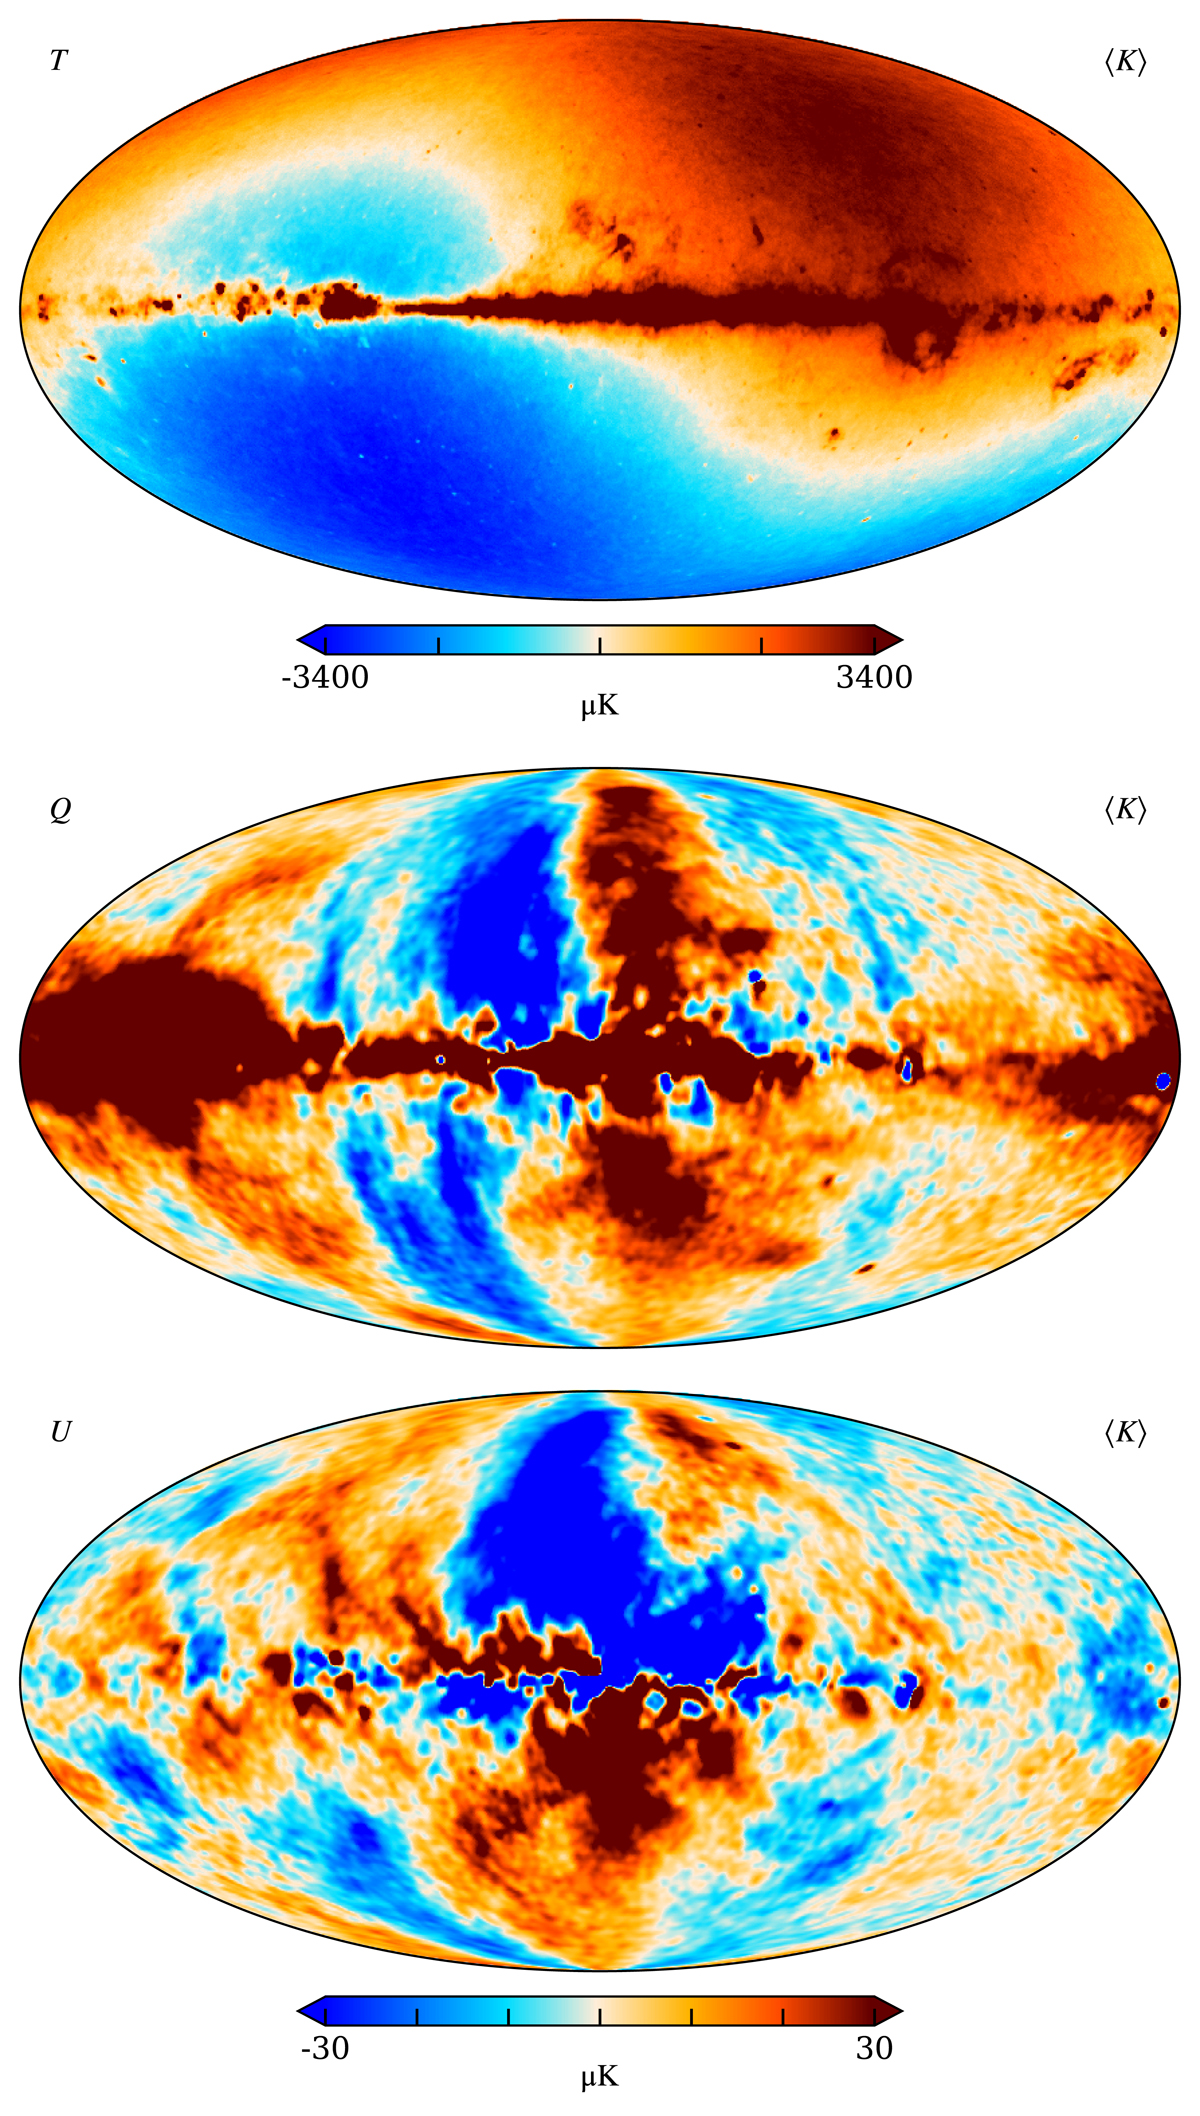
Posterior mean K-band map produced with the COSMOGLOBE pipeline. Rows show Stokes T, Q, and U, respectively. The temperature map is shown at full resolution, while the polarization maps are smoothed with a 2° FWHM Gaussian beam to reduce small-scale noise.
Current usage metrics show cumulative count of Article Views (full-text article views including HTML views, PDF and ePub downloads, according to the available data) and Abstracts Views on Vision4Press platform.
Data correspond to usage on the plateform after 2015. The current usage metrics is available 48-96 hours after online publication and is updated daily on week days.
Initial download of the metrics may take a while.