Fig. 9.
Download original image
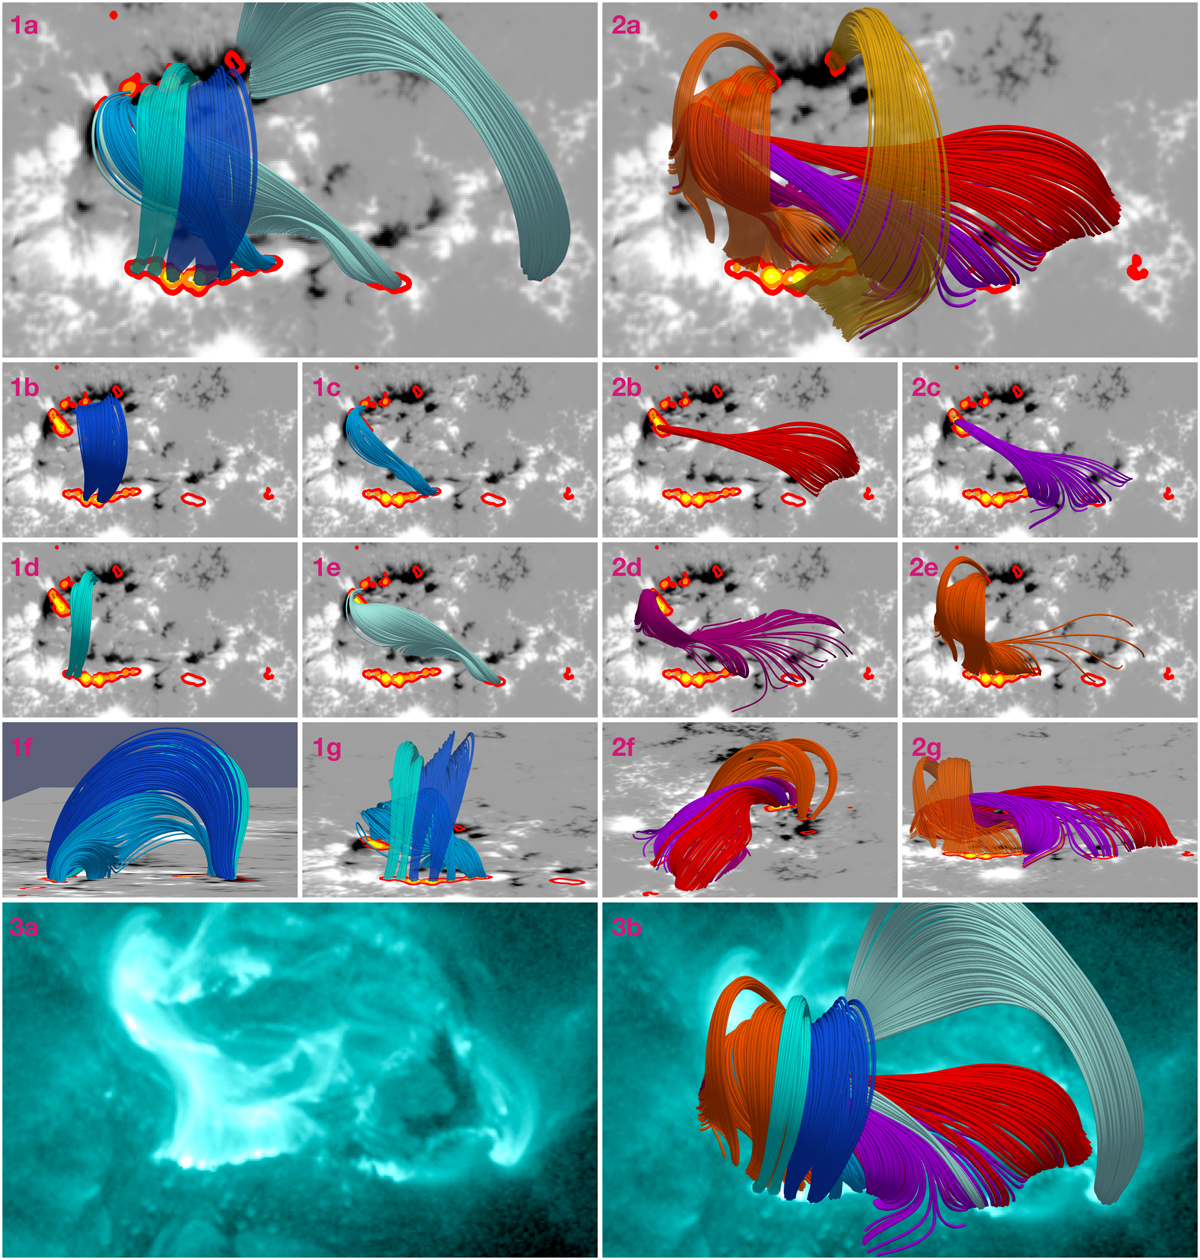
Field lines from a pre-flare magnetic field reconstruction (11:00 UT) that are associated with the AIA 1600 Å flare ribbon enhancements during HXR peak 1. Panel 1a: all field lines with seed points within a positive polarity region. Panels 1b–1e: individual display of selected field lines. Panels 1f and 1g: Combined field lines shown from two different perspectives. Panels 2a–2g: same structure but for field lines with seed points in negative polarity regions. Panel 3a: an AIA 131 Å image taken during HXR peak 1. Panel 3b: combined structure of field lines with seed points selected from footpoints in both polarities.
Current usage metrics show cumulative count of Article Views (full-text article views including HTML views, PDF and ePub downloads, according to the available data) and Abstracts Views on Vision4Press platform.
Data correspond to usage on the plateform after 2015. The current usage metrics is available 48-96 hours after online publication and is updated daily on week days.
Initial download of the metrics may take a while.