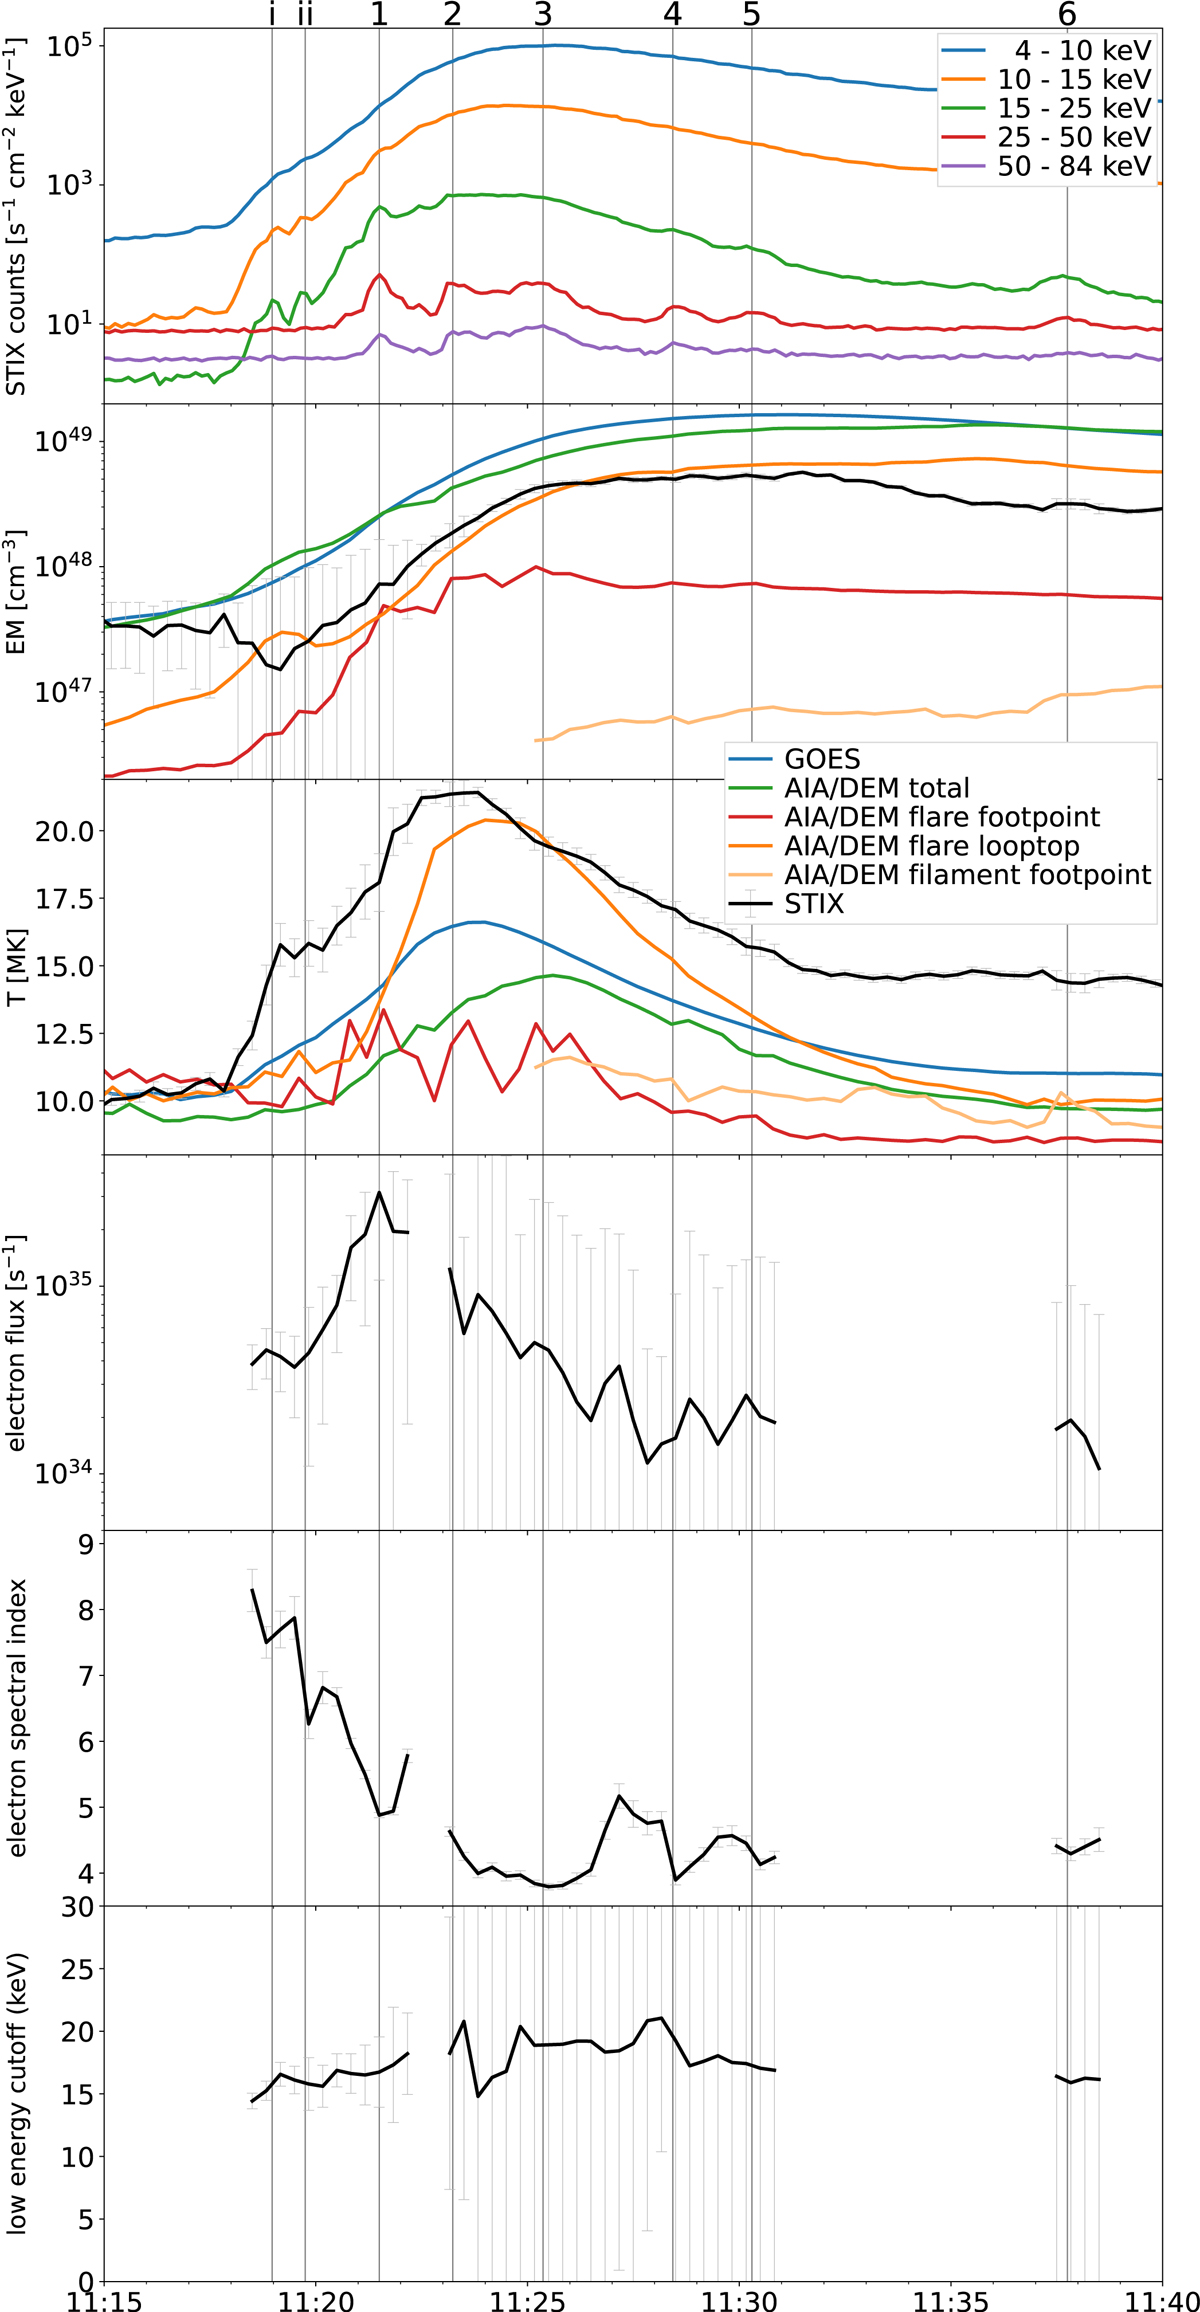
Fig. 8.
Download original image
Thermal and nonthermal emission characteristics from AIA, GOES, and STIX. From top to bottom: 1) STIX count flux in five energy ranges. Vertical lines mark the times of HXR peaks and are labeled on top. 2) Time evolution of the EM derived from the different instruments and for different subregions. 3) Same as 2) but for the plasma temperature. 4) Electron flux with errors derived from the nonthermal fit to the STIX spectrum. 5) Electron spectral index. 6) Low energy cutoff of the accelerated electron distribution.
Current usage metrics show cumulative count of Article Views (full-text article views including HTML views, PDF and ePub downloads, according to the available data) and Abstracts Views on Vision4Press platform.
Data correspond to usage on the plateform after 2015. The current usage metrics is available 48-96 hours after online publication and is updated daily on week days.
Initial download of the metrics may take a while.