Fig. 7.
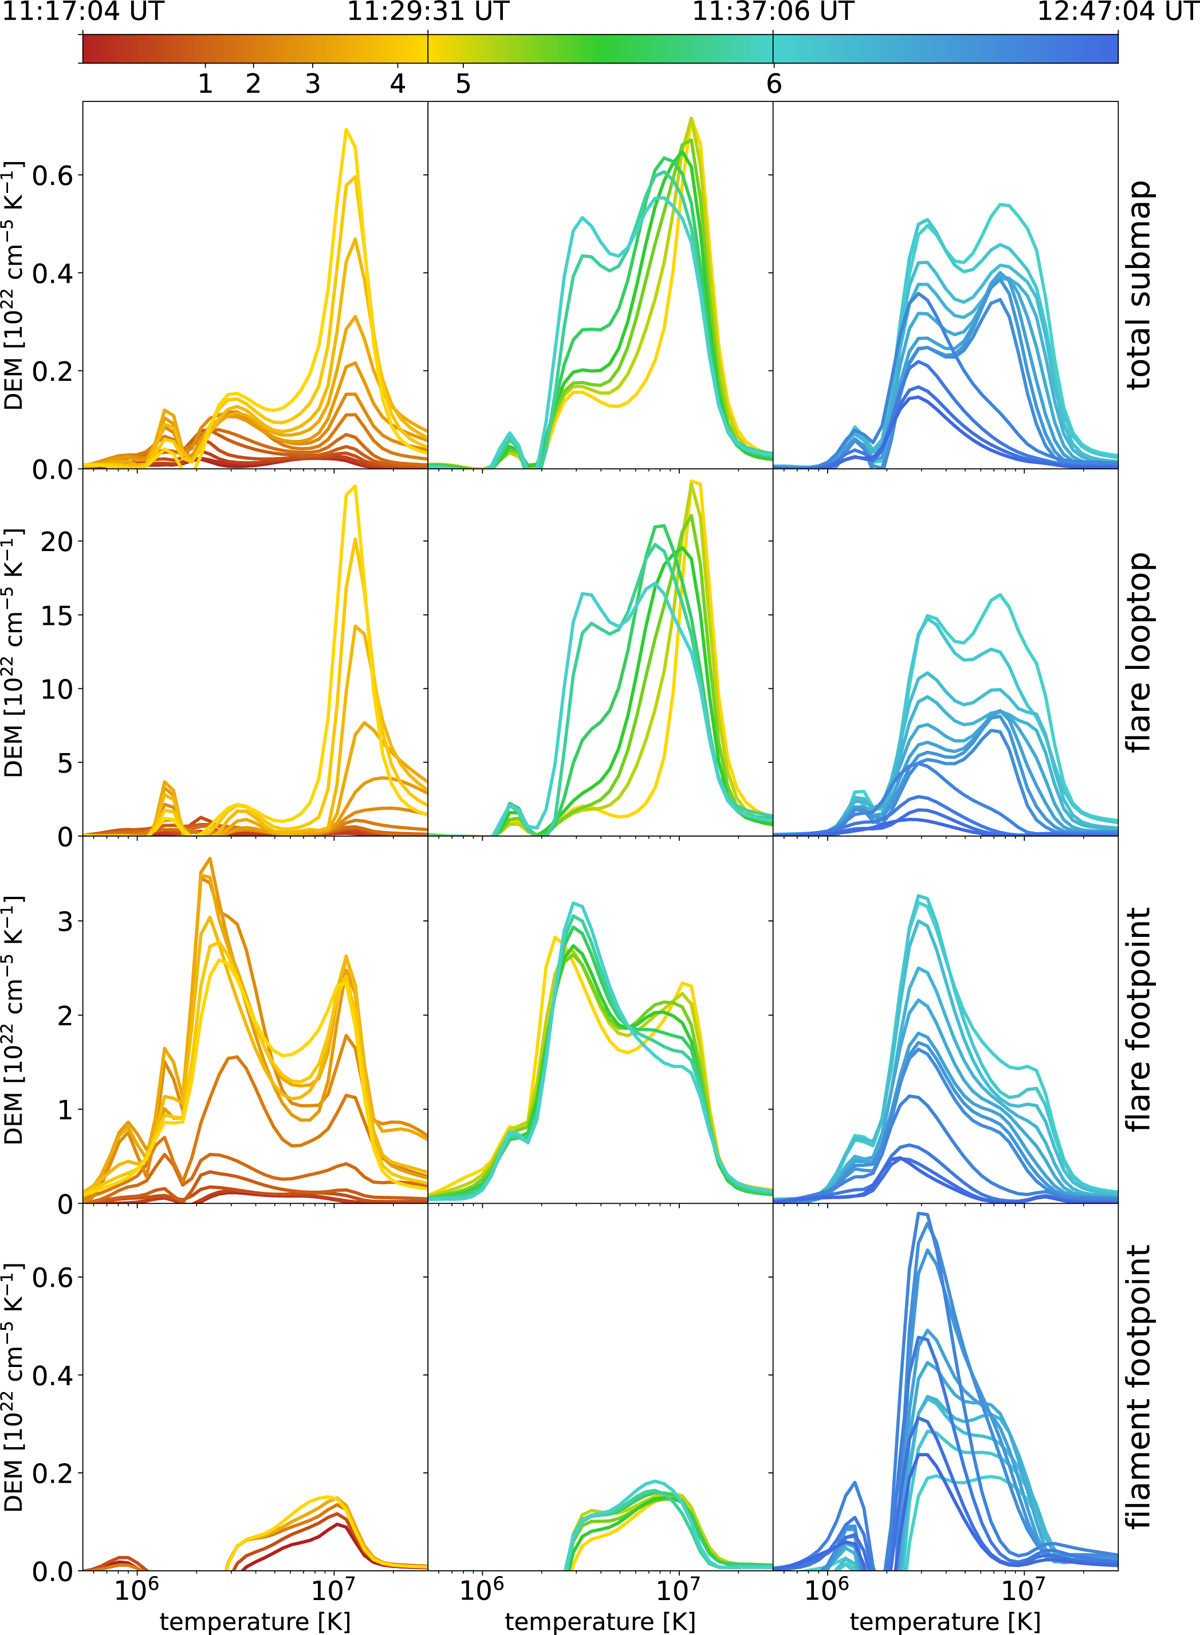
Download original image
Mean DEM distribution during three distinct phases (columns). Each row corresponds to one of the three subregions defined in Fig. 6 or the whole FOV and is labeled on the right. Colors represent time, with marked time intervals having different durations. The times of the HXR peaks are marked at the bottom of the color bar.
Current usage metrics show cumulative count of Article Views (full-text article views including HTML views, PDF and ePub downloads, according to the available data) and Abstracts Views on Vision4Press platform.
Data correspond to usage on the plateform after 2015. The current usage metrics is available 48-96 hours after online publication and is updated daily on week days.
Initial download of the metrics may take a while.