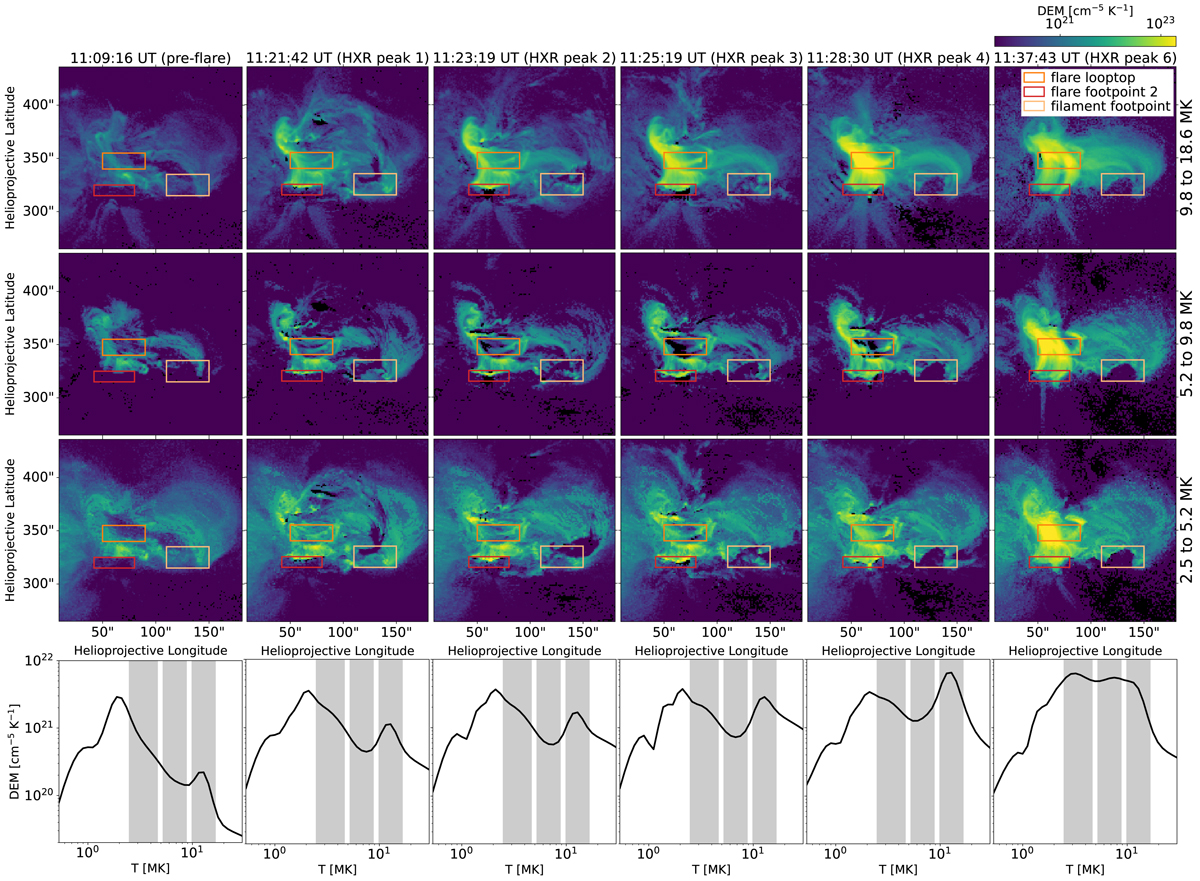
Fig. 6.
Download original image
DEM reconstructions from selected times during the event. Top rows: DEM maps for six selected times (columns), showing for each pixel the mean DEM in three adjacent temperature ranges (rows): 9.8–18.6 MK (first row), 5.2–9.8 MK (second row), 2.5–5.2 MK (bottom row). The time of the DEM reconstruction and the corresponding HXR peak are given at the top of each column. Bottom row: mean DEM distribution of all pixels as a function of temperature for the selected times. The gray areas mark the temperature ranges for the DEM maps shown above. A movie is available online.
Current usage metrics show cumulative count of Article Views (full-text article views including HTML views, PDF and ePub downloads, according to the available data) and Abstracts Views on Vision4Press platform.
Data correspond to usage on the plateform after 2015. The current usage metrics is available 48-96 hours after online publication and is updated daily on week days.
Initial download of the metrics may take a while.