Fig. 5.
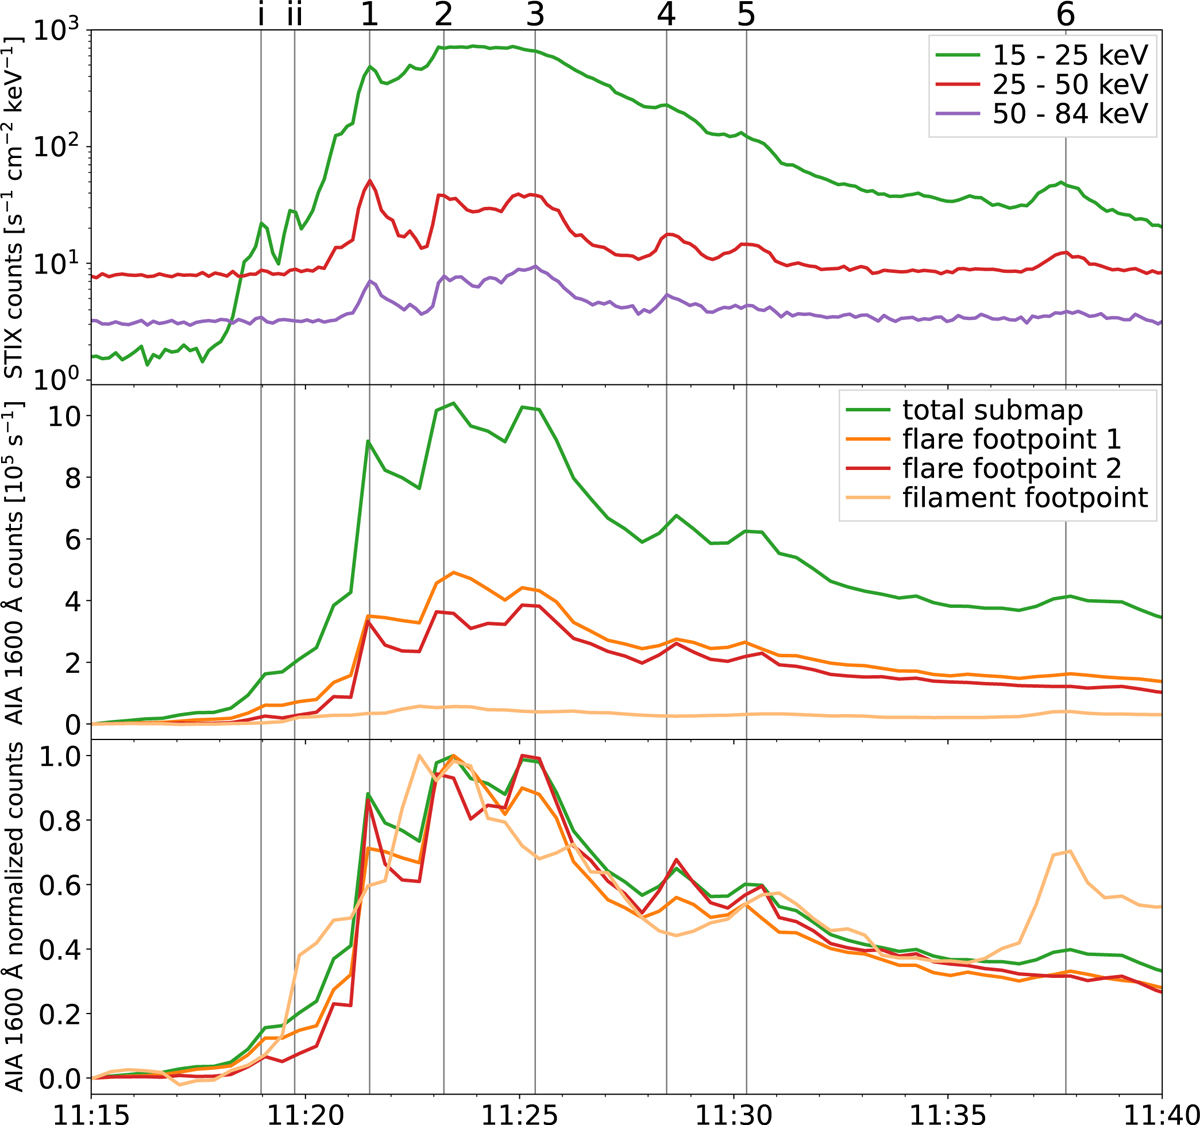
Download original image
Time correlation between STIX HXR counts and AIA 1600 Å counts in selected subregions. Top panel: STIX count flux in three different energy ranges. Times of prominent HXR peaks are marked by vertical lines and labeled on top. Middle panel: total AIA 1600 Å counts for subregions marked in Fig. 4. Bottom panel: normalized total AIA 1600 Å counts for the same subregions.
Current usage metrics show cumulative count of Article Views (full-text article views including HTML views, PDF and ePub downloads, according to the available data) and Abstracts Views on Vision4Press platform.
Data correspond to usage on the plateform after 2015. The current usage metrics is available 48-96 hours after online publication and is updated daily on week days.
Initial download of the metrics may take a while.