Fig. 2.
Download original image
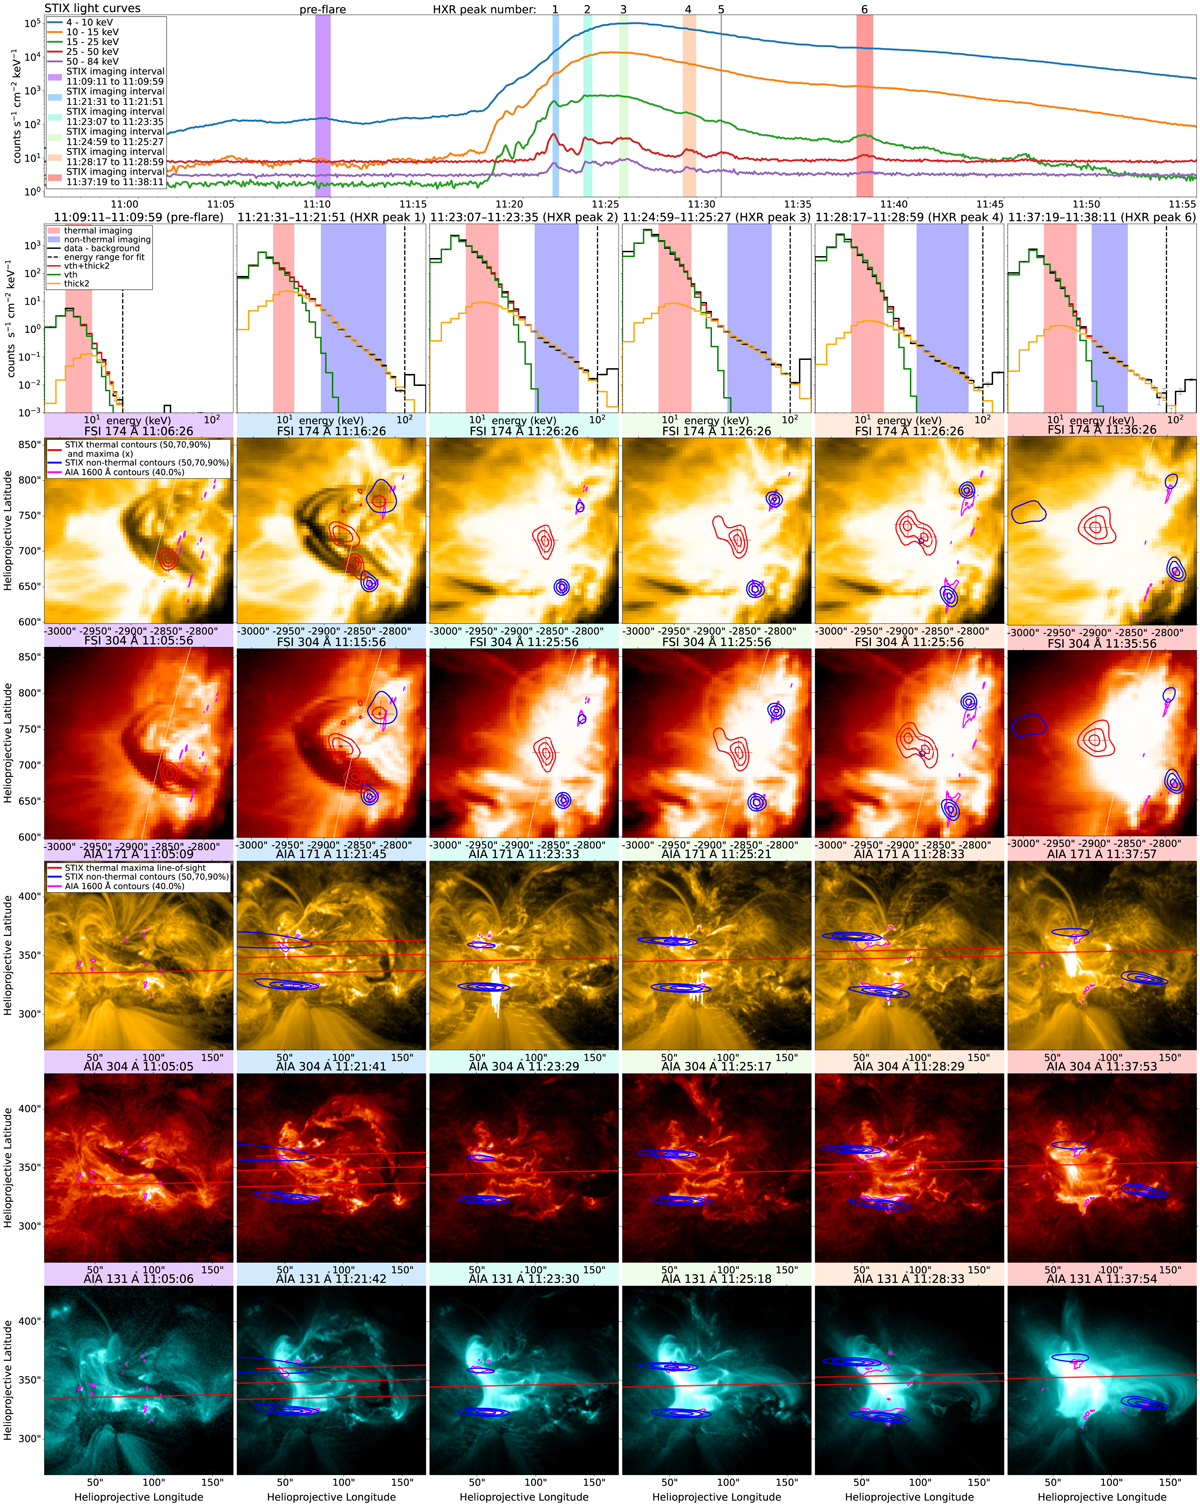
STIX observations of the event and comparison with EUI and AIA images. Top row: STIX light curves for five energy ranges with marked time intervals for selected HXR peaks. Columns: color-coded corresponding to the marked time intervals containing the following observations: 1) STIX X-ray spectrum fitted with a thermal (vth) and nonthermal (thick2) electron model. Energy intervals used for imaging are marked. 2) STIX clean image contours on top of the closest available EUI FSI 174 Å image. Maxima of thermal contours are marked. 3) Same as 2) but with EUI FSI 304 Å image. 4) AIA 171 Å image with reprojected STIX nonthermal contours and the LOSs through the maxima of STIX thermal sources. 5) and 6) as 4) but with AIA 304 and 131 Å images, respectively.
Current usage metrics show cumulative count of Article Views (full-text article views including HTML views, PDF and ePub downloads, according to the available data) and Abstracts Views on Vision4Press platform.
Data correspond to usage on the plateform after 2015. The current usage metrics is available 48-96 hours after online publication and is updated daily on week days.
Initial download of the metrics may take a while.