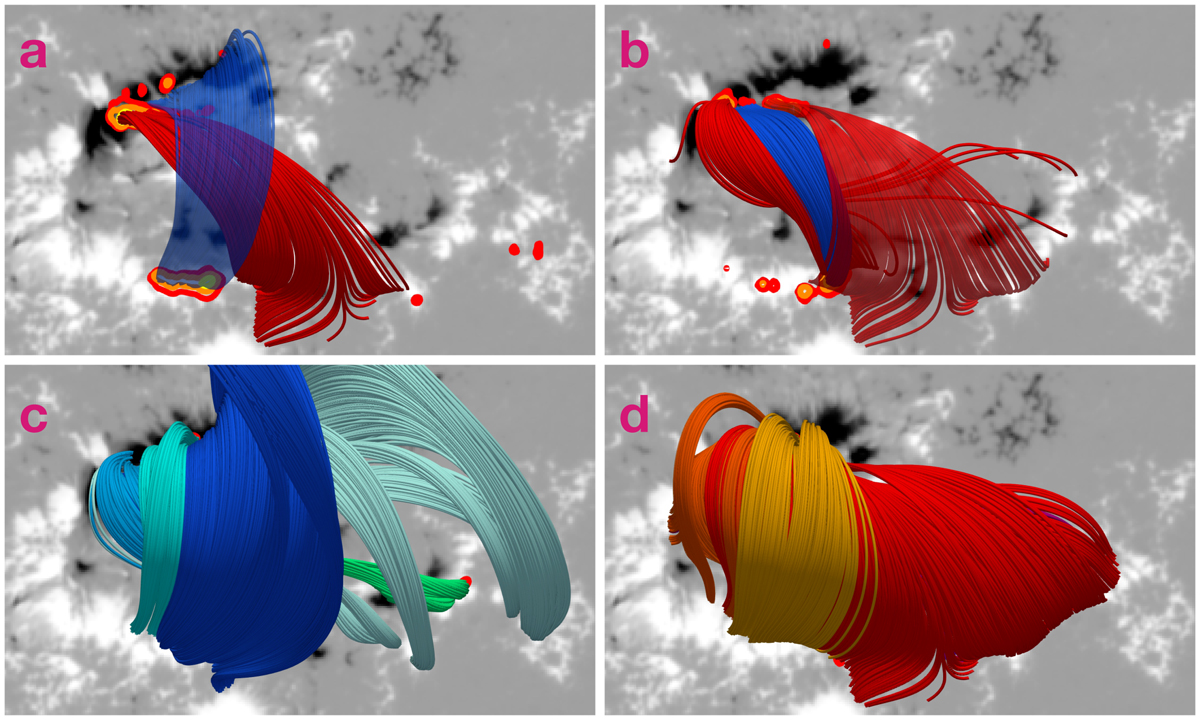
Fig. 11.
Download original image
Pre-flare magnetic field structures involved in the remaining HXR peaks. Panels a and b show the main fields that became involved in HXR peaks 2 and 3, respectively. Panels c and d show all field lines seeded during any HXR peak in the positive and negative polarity, respectively. Field lines from the first (1) and last (6) HXR peak are colored the same way as shown in Fig. 9 while those from the HXR peaks in between are shown as blue and red.
Current usage metrics show cumulative count of Article Views (full-text article views including HTML views, PDF and ePub downloads, according to the available data) and Abstracts Views on Vision4Press platform.
Data correspond to usage on the plateform after 2015. The current usage metrics is available 48-96 hours after online publication and is updated daily on week days.
Initial download of the metrics may take a while.