Fig. 1.
Download original image
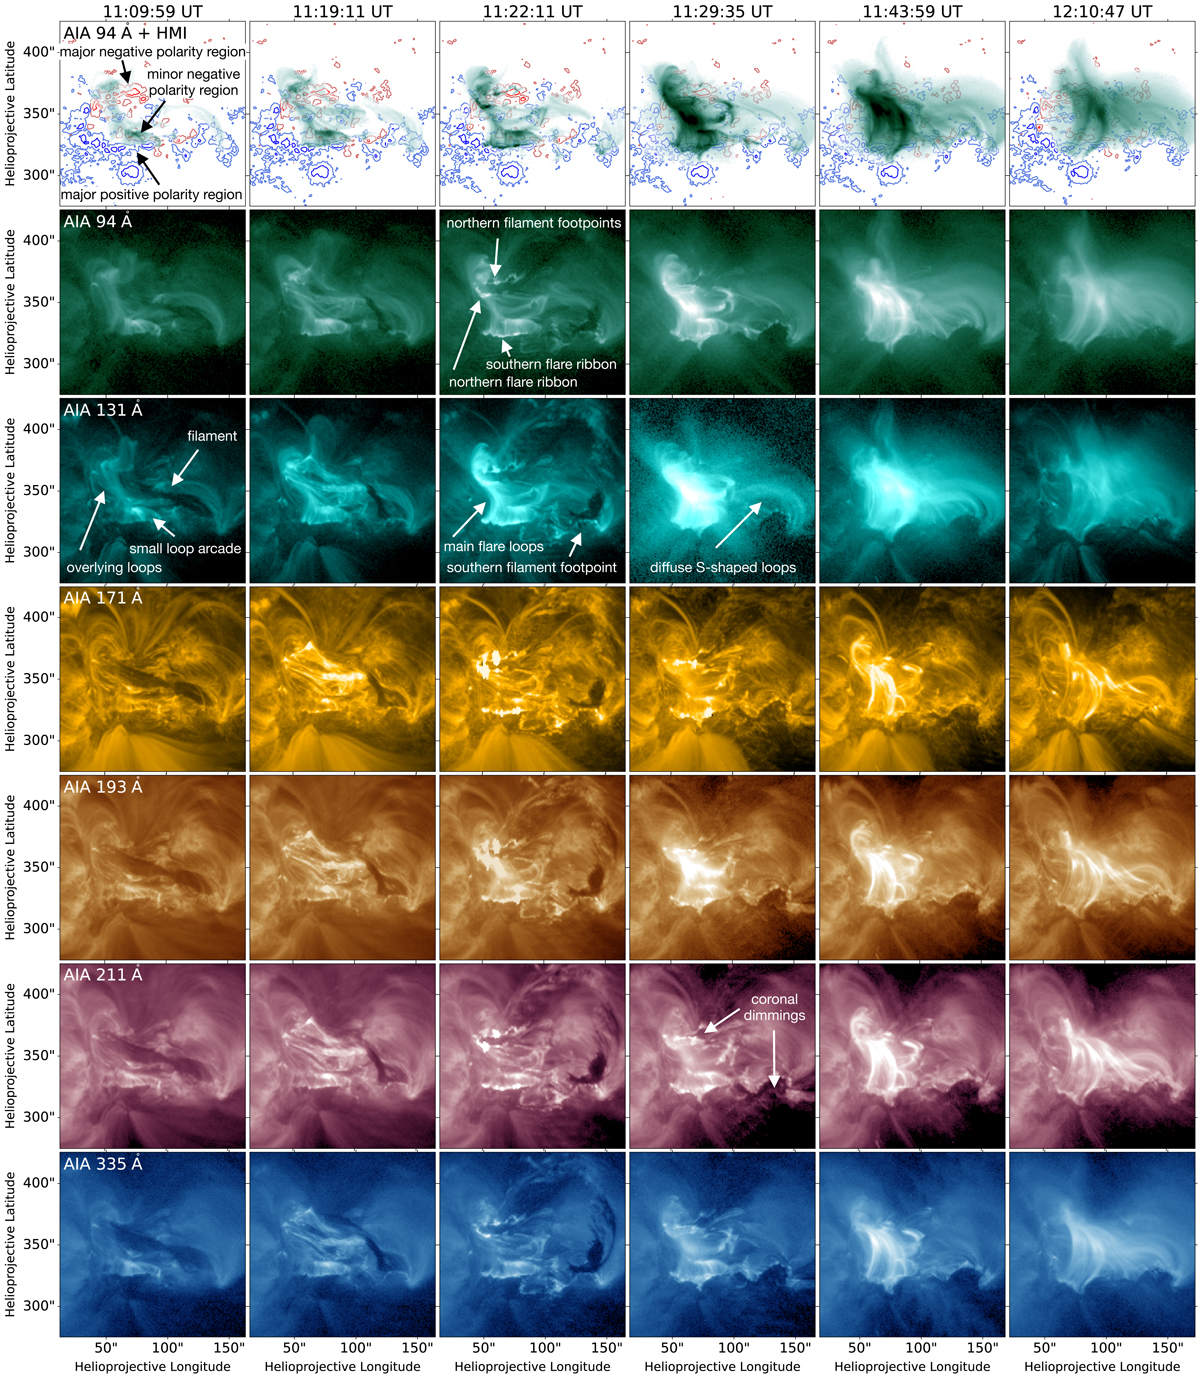
Event overview in six AIA EUV wavelength channels at six selected times (columns). Images are normalized by exposure time and scaled to a fixed minimum and maximum value for each channel. The first row shows inverted AIA 94 Å images together with HMI LOS magnetogram contours marking levels of ±200 and ±1000 G for negative (red) and positive (blue) polarity. A movie is available online.
Current usage metrics show cumulative count of Article Views (full-text article views including HTML views, PDF and ePub downloads, according to the available data) and Abstracts Views on Vision4Press platform.
Data correspond to usage on the plateform after 2015. The current usage metrics is available 48-96 hours after online publication and is updated daily on week days.
Initial download of the metrics may take a while.