Fig. 5.
Download original image
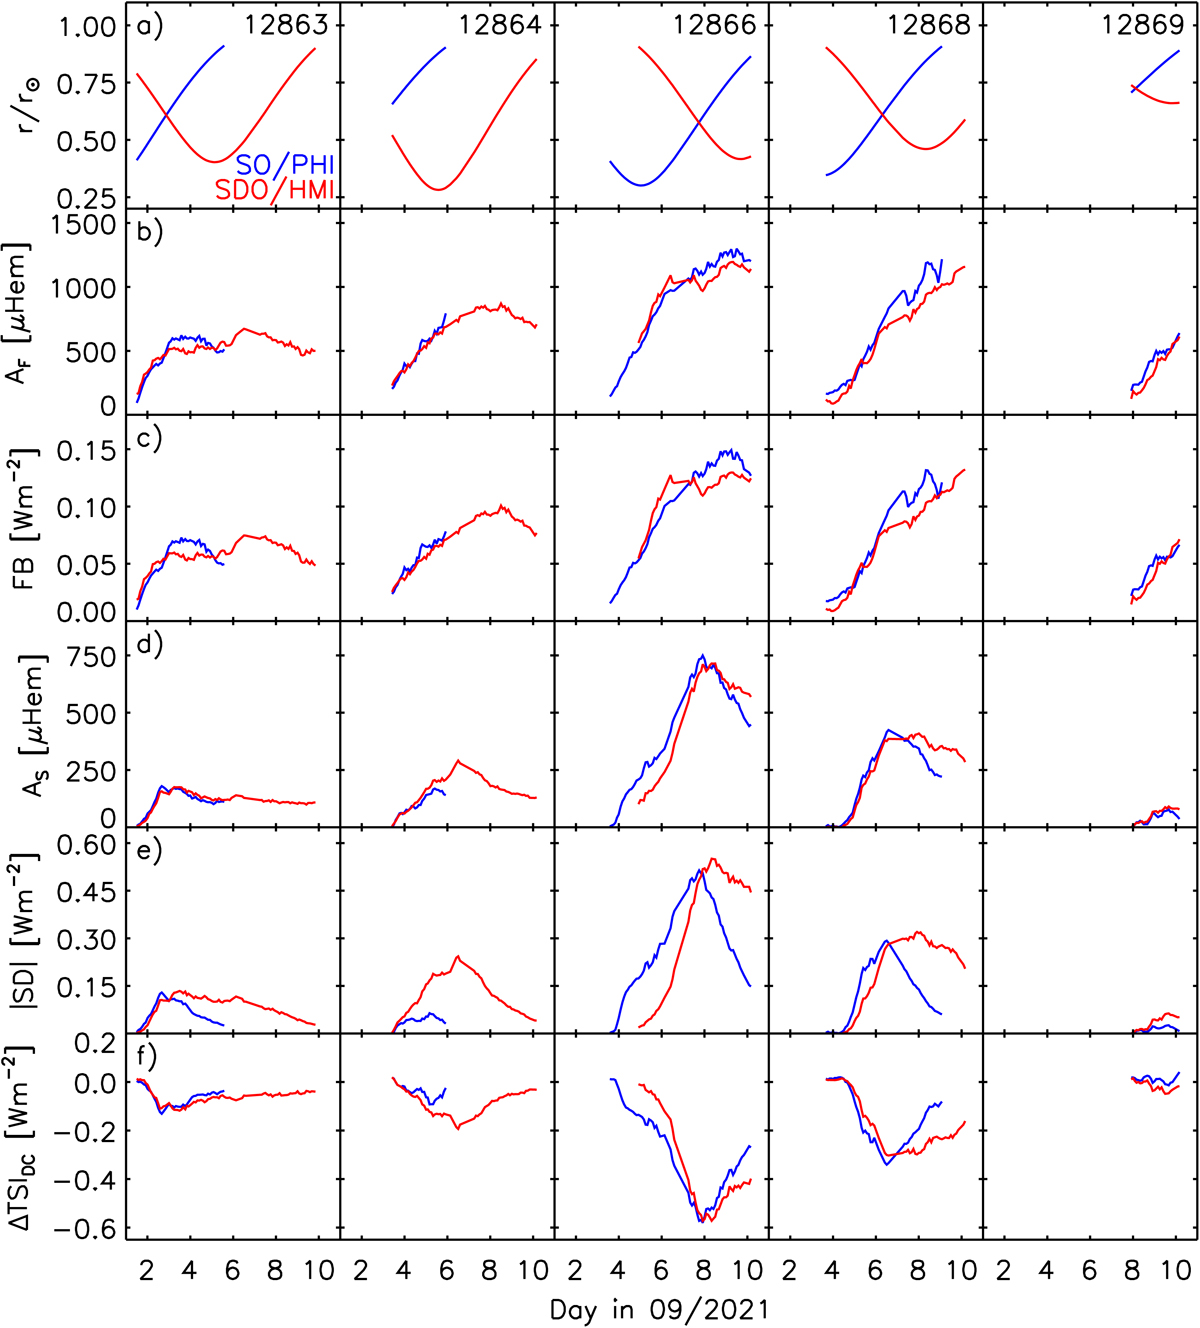
Properties of the five active regions that emerged during P1 and imaged by both SO/PHI and SDO/HMI (outlined by blue contours in Fig. 4), as a function of time: (a) the distance from disc centre, ![]() , (b) foreshortening-corrected facular area, AF in millionths of the solar hemisphere, μHem, (c) the change in TSI due to faculae, FB. Rows (d) and (e) represent the same as rows (b) and (c), except for sunspots. In row (f), we chart the total change in TSI (i.e. both faculae brightening and sunspot darkening) produced by each active region to an observer that follows it such that it is always at disc centre, ΔTSIDC. The blue (red) solid lines follow the values from the SO/PHI (SDO/HMI) data set and the corresponding TSI reconstruction. See Sect. 3 for details.
, (b) foreshortening-corrected facular area, AF in millionths of the solar hemisphere, μHem, (c) the change in TSI due to faculae, FB. Rows (d) and (e) represent the same as rows (b) and (c), except for sunspots. In row (f), we chart the total change in TSI (i.e. both faculae brightening and sunspot darkening) produced by each active region to an observer that follows it such that it is always at disc centre, ΔTSIDC. The blue (red) solid lines follow the values from the SO/PHI (SDO/HMI) data set and the corresponding TSI reconstruction. See Sect. 3 for details.
Current usage metrics show cumulative count of Article Views (full-text article views including HTML views, PDF and ePub downloads, according to the available data) and Abstracts Views on Vision4Press platform.
Data correspond to usage on the plateform after 2015. The current usage metrics is available 48-96 hours after online publication and is updated daily on week days.
Initial download of the metrics may take a while.