Fig. 4.
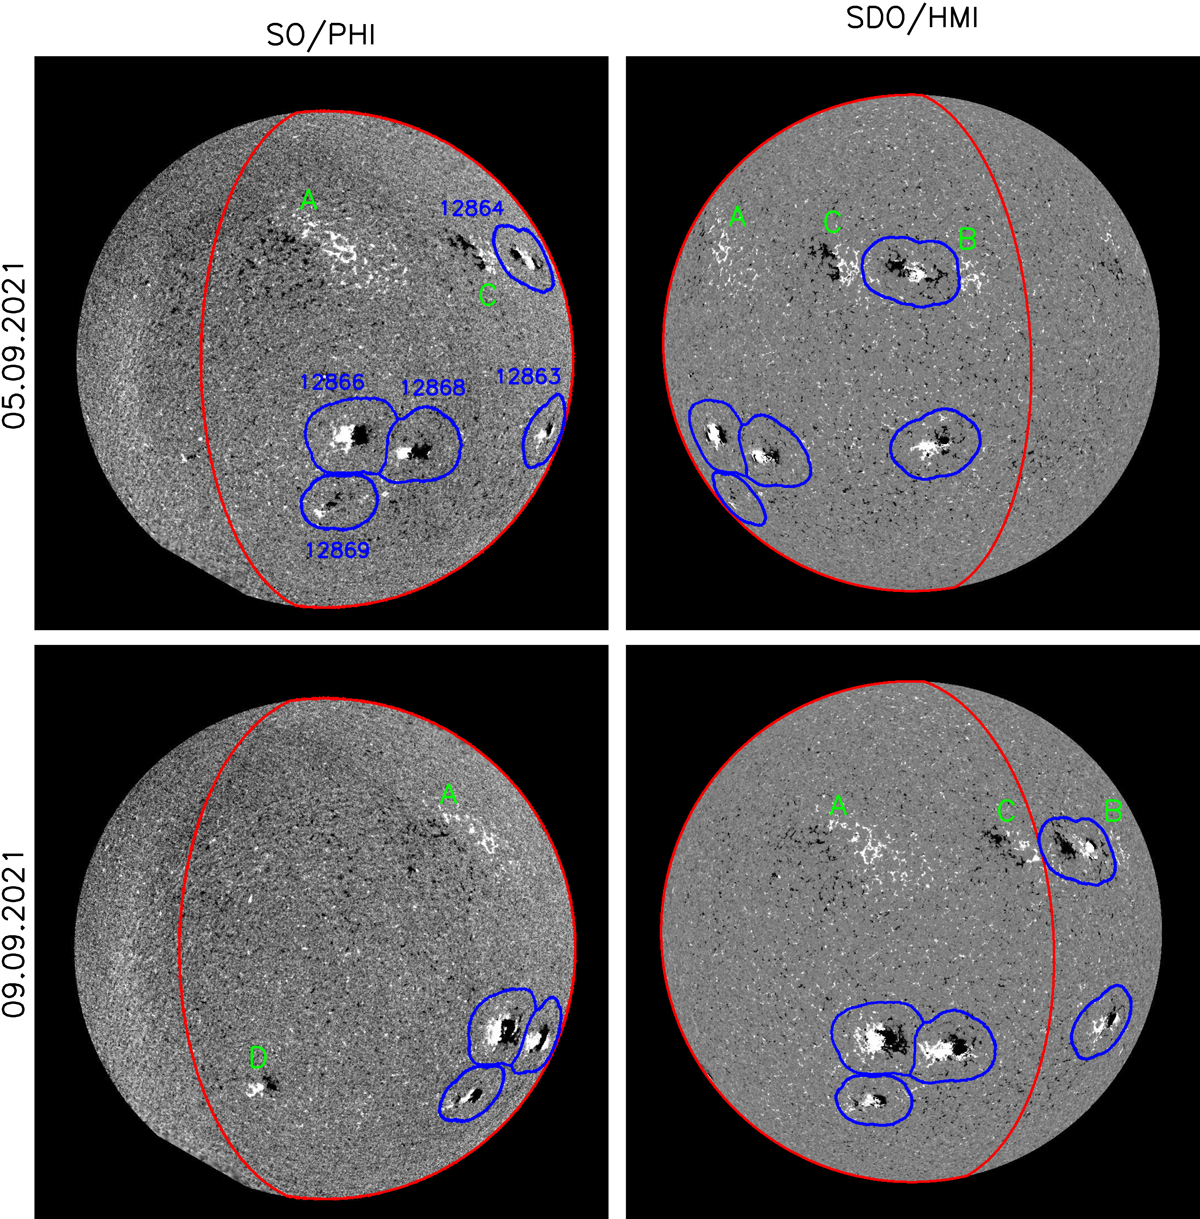
Download original image
Simultaneous SO/PHI (left) and SDO/HMI line-of-sight magnetogram (right) recorded during P1 on 05.09.2021 (top), and 09.09.2021 (bottom). The position of SO/PHI relative to the Sun-SDO/HMI line at these times is indicated in Fig. 1 (blue plus symbols). The part of the solar surface within view of both instruments is encircled in red. The five active regions (ARs) that emerged within P1 and were imaged by both instruments are encircled in blue. The NOAA AR number is indicated in the top-left panel. The magnetic features marked “A” and “B” correspond to remnants of ARs which dissipated before P1, and “C” and “D” to ARs which do not meet the aforementioned criteria, discussed in Appendix A. The greyscale is saturated for the SO/PHI and SDO/HMI magnetograms at ±31 G and ±45 G, respectively. This corresponds to the magnetogram signal threshold applied to separate faculae from magnetogram noise (Sect. 2.3).
Current usage metrics show cumulative count of Article Views (full-text article views including HTML views, PDF and ePub downloads, according to the available data) and Abstracts Views on Vision4Press platform.
Data correspond to usage on the plateform after 2015. The current usage metrics is available 48-96 hours after online publication and is updated daily on week days.
Initial download of the metrics may take a while.