Fig. 2.
Download original image
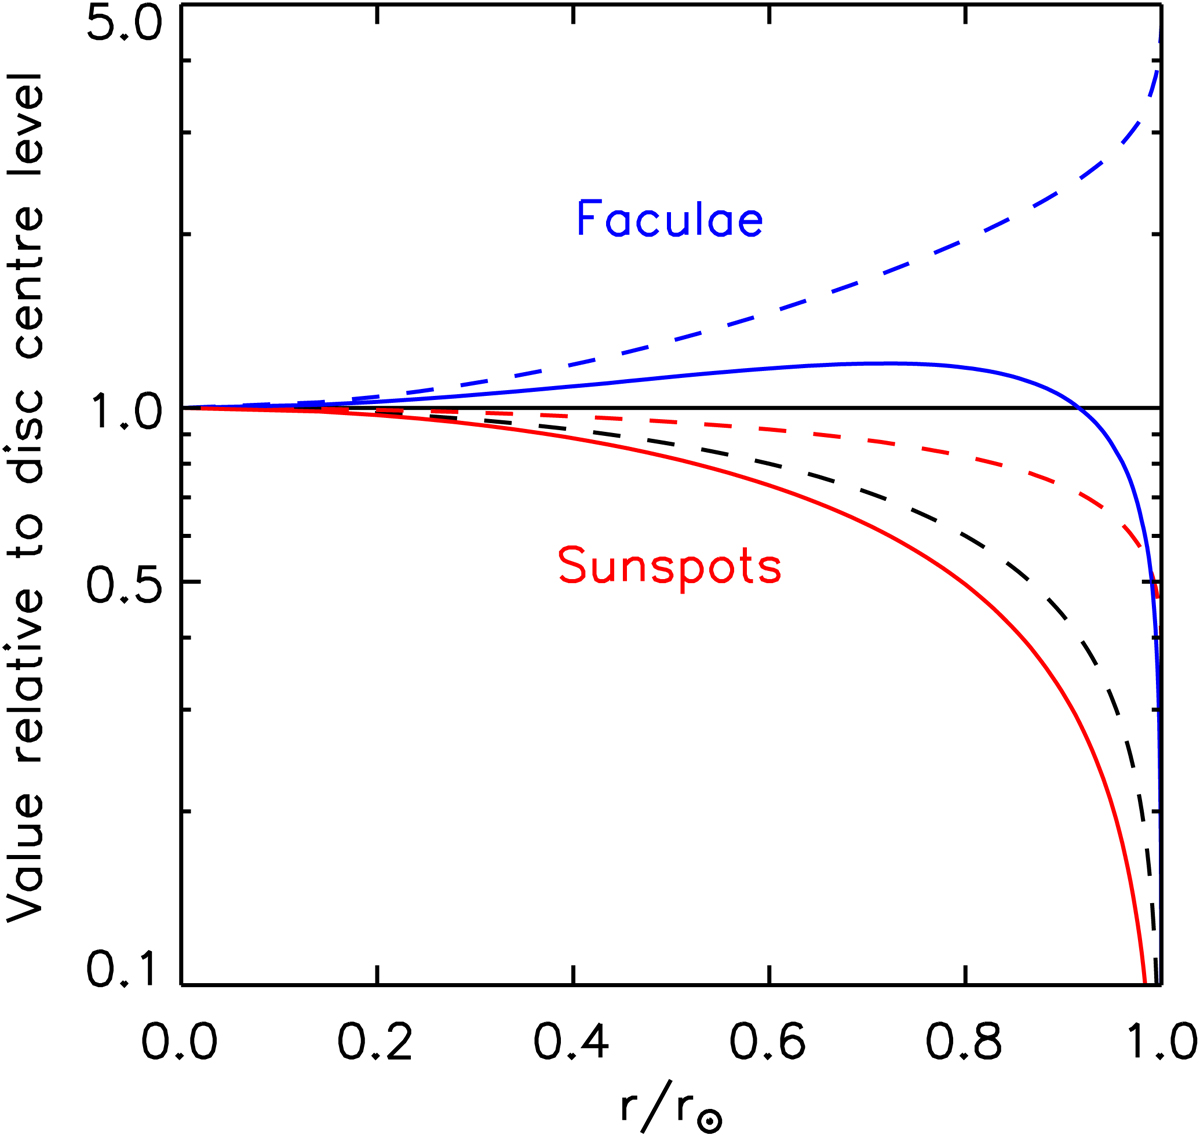
TSI excess produced by a given facular feature in SATIRE-S (blue solid line) and the facular intensity contrast adopted by the model (blue dashed line), from Unruh et al. (1999), as a function of distance from disc centre, ![]() . The red solid and dashed lines represent the same for sunspots. The black dashed line follows the projected area of a given solar surface feature (i.e., foreshortening). Each quantity is normalised to the disc centre value (black solid line). The model treats sunspot umbra and sunspot penumbra separately, and assumes an umbral to penumbral area ratio of 1:4. For each quantity depicted, the sunspot profile is given by the mean of the umbral and penumbral profiles, weighted by this ratio.
. The red solid and dashed lines represent the same for sunspots. The black dashed line follows the projected area of a given solar surface feature (i.e., foreshortening). Each quantity is normalised to the disc centre value (black solid line). The model treats sunspot umbra and sunspot penumbra separately, and assumes an umbral to penumbral area ratio of 1:4. For each quantity depicted, the sunspot profile is given by the mean of the umbral and penumbral profiles, weighted by this ratio.
Current usage metrics show cumulative count of Article Views (full-text article views including HTML views, PDF and ePub downloads, according to the available data) and Abstracts Views on Vision4Press platform.
Data correspond to usage on the plateform after 2015. The current usage metrics is available 48-96 hours after online publication and is updated daily on week days.
Initial download of the metrics may take a while.