Fig. 9.
Download original image
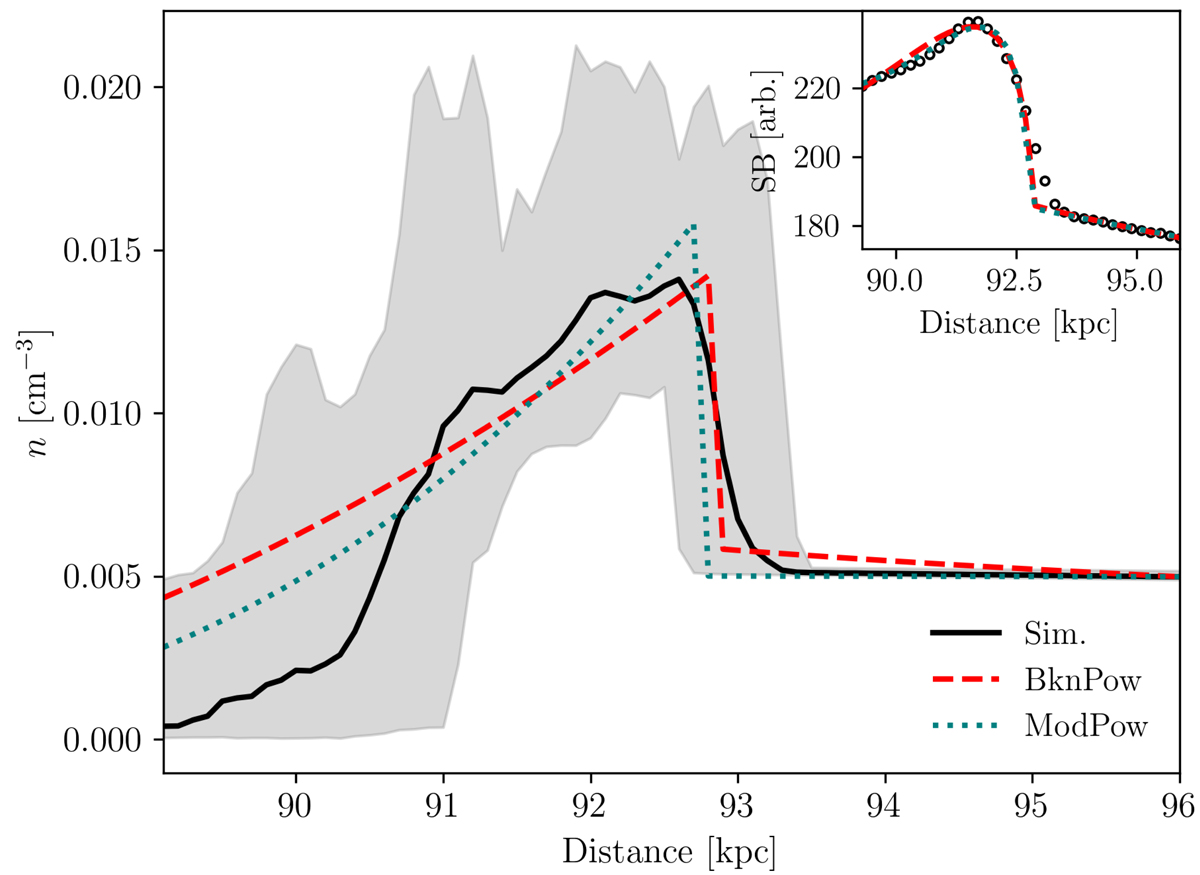
Radial profile of thermal density. Red dashed and green dotted lines correspond to the best fitting BknPow model and ModPow model at a 90° viewing angle, respectively. A sector to measure the surface brightness profiles is shown in Fig. A.1 at a 90° viewing angle. We measure the thermal density profile from the simulation result at the x − z plane (y = 0 kpc) in the sector. The shaded region shows the maximum and minimum thermal density, and the black solid line represents the average value. The BknPow and ModBkn models fit the jumps with a shock compression ratio C = 2.44 ± 0.13 and 3.82 ± 0.16, respectively. The surface brightness profile (black circles), the best fits of BknPow (red dashed line) and ModBkn (green dotted line) are shown in the inset.
Current usage metrics show cumulative count of Article Views (full-text article views including HTML views, PDF and ePub downloads, according to the available data) and Abstracts Views on Vision4Press platform.
Data correspond to usage on the plateform after 2015. The current usage metrics is available 48-96 hours after online publication and is updated daily on week days.
Initial download of the metrics may take a while.