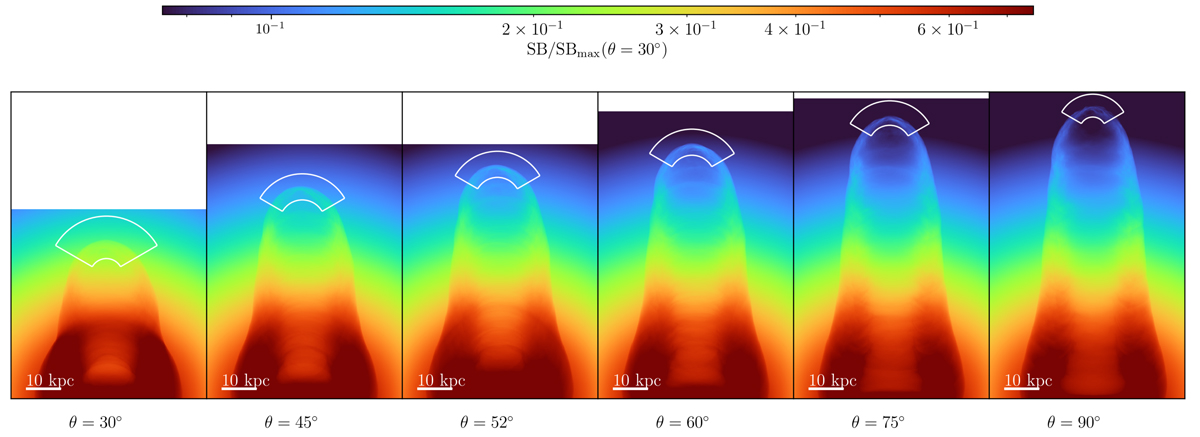
Fig. A.1.
Download original image
Simulated X-ray surface brightness maps of a AGN jet at 30, 45, 52, 60, 75, and 90 degrees viewing angles (from left to right panels), respectively. The values for each plot are normalized by a maximum value in the case of a 30 degree viewing angle. The green annular sector depicts the shock regions where the surface brightness profiles have been extracted.
Current usage metrics show cumulative count of Article Views (full-text article views including HTML views, PDF and ePub downloads, according to the available data) and Abstracts Views on Vision4Press platform.
Data correspond to usage on the plateform after 2015. The current usage metrics is available 48-96 hours after online publication and is updated daily on week days.
Initial download of the metrics may take a while.